Play Count By Clip Report
BackReport Description
This report produces the number of times a clip(s) played within certain date and time parameters.
Data Output
- Media Type
- Meta ID
- Media Title
- Media Duration
- Count
- Media Duration
- Total Media Duration
Step-by-step guide on how to draw a Play Count By Clip Report
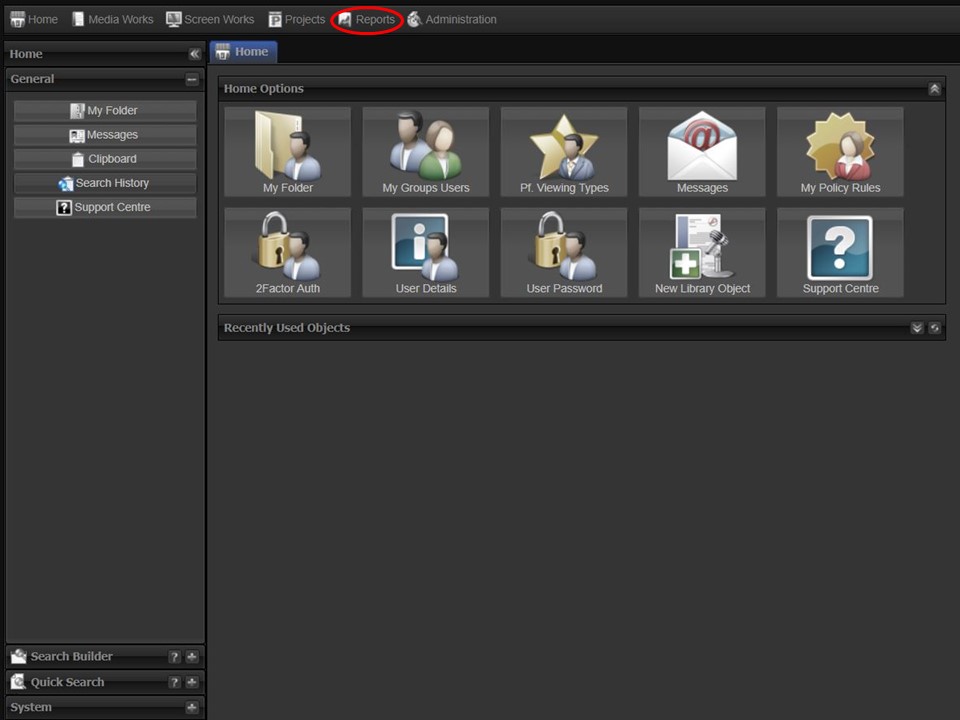
1. Click on the Reports tab at the top of the screen.
2. Click on the Player Reports icon. The Player Reports module will open.
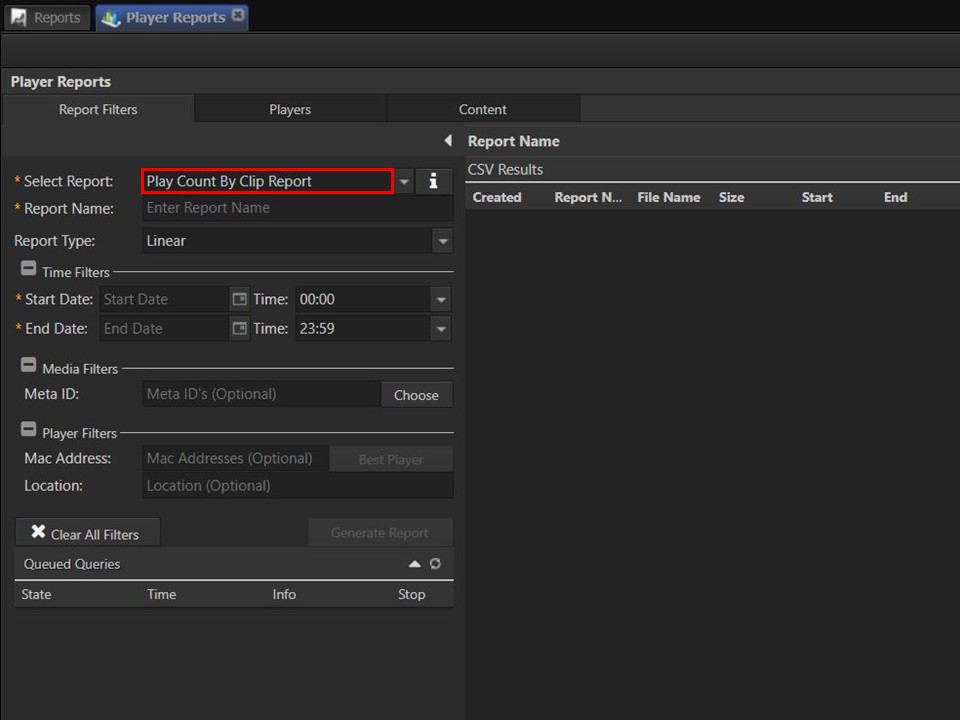
3. Select the Play Count By Clip Report from the drop-down.
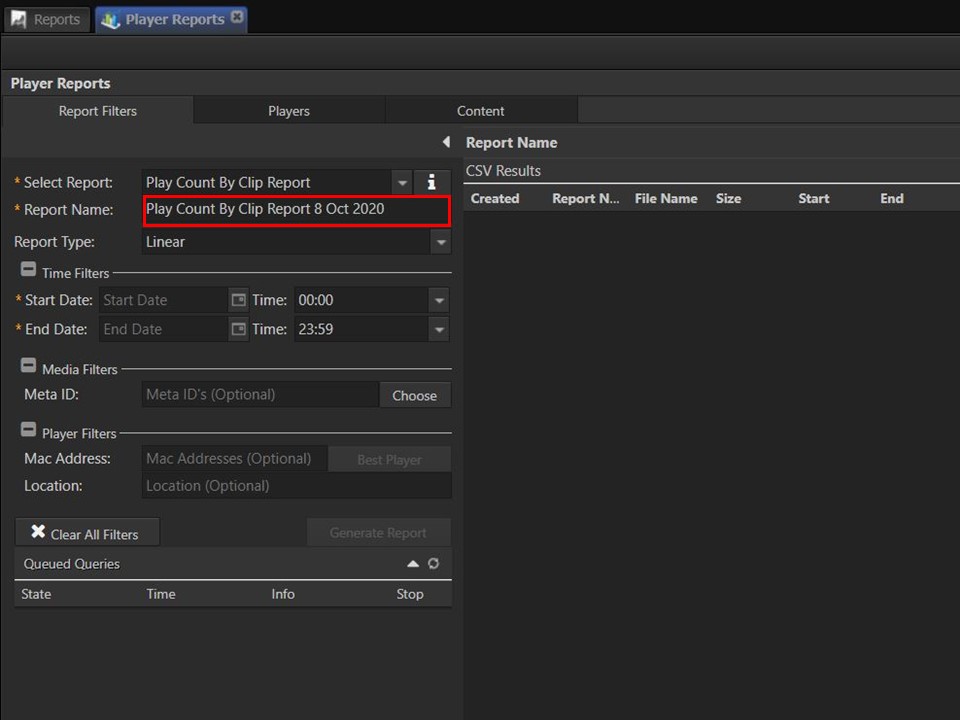
4. Type the name you would like to give your exported report in the Report Name field.
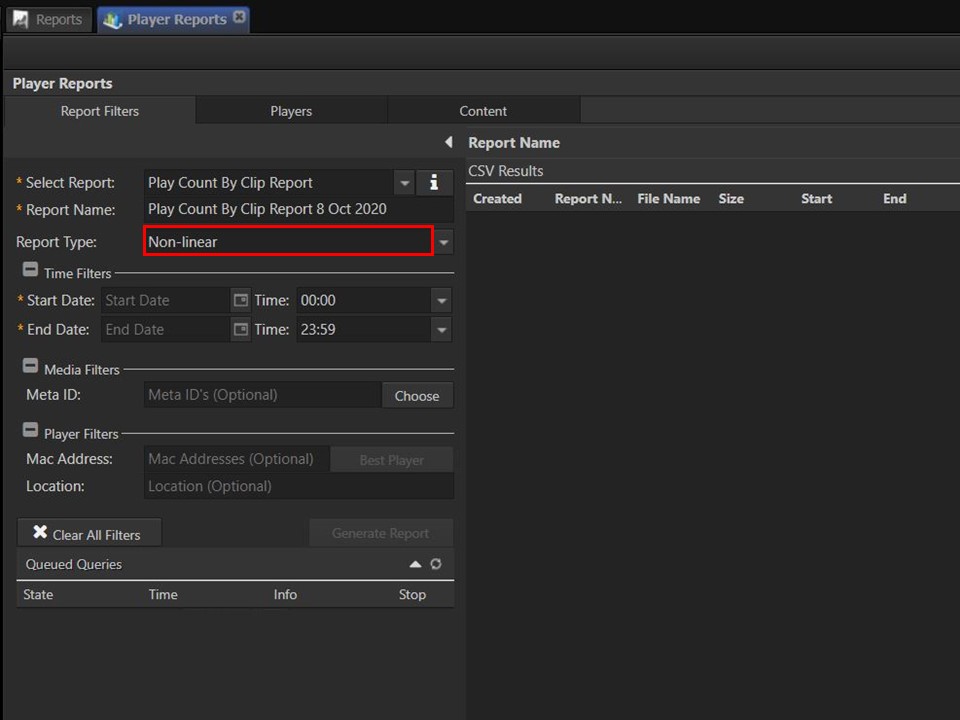
5. Select the Report Type from the drop-down menu.
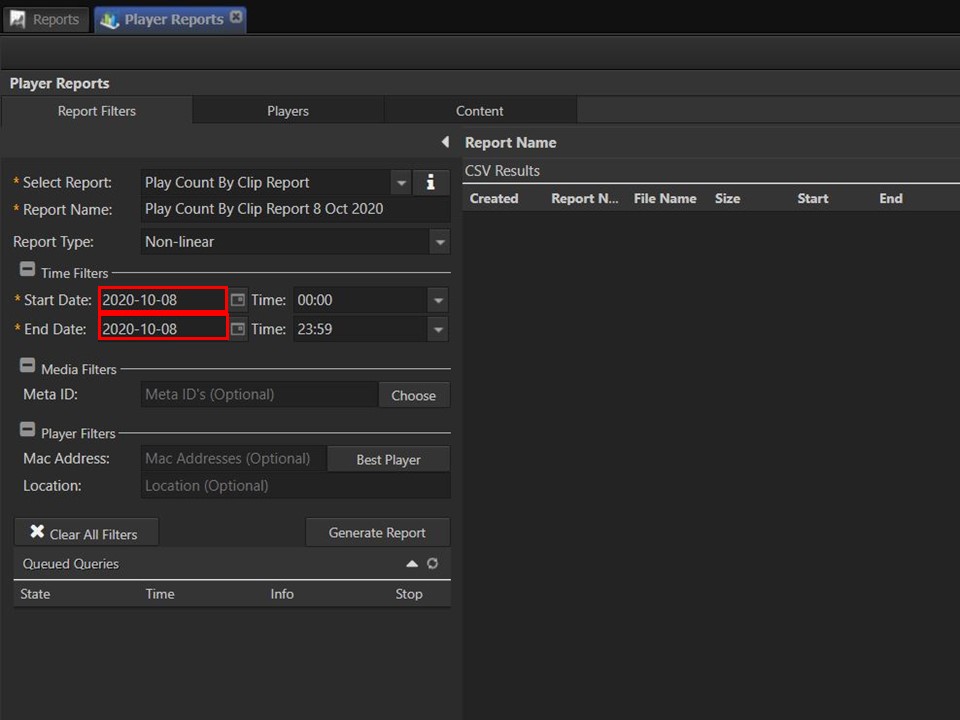
6. Select the Start and End date parameters.
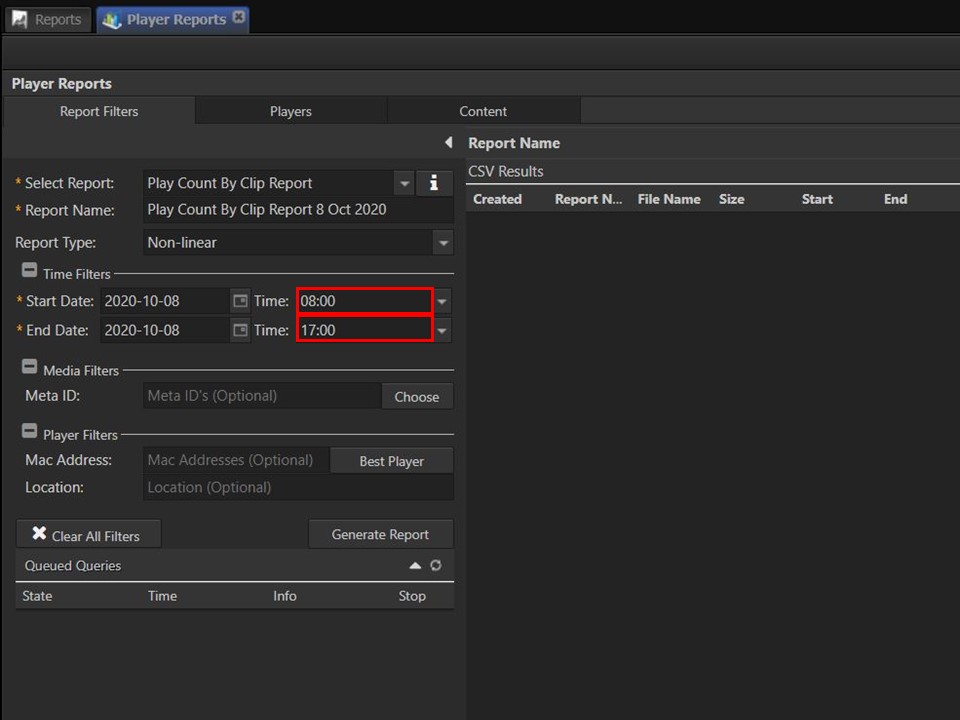
7. Select the time parameters.
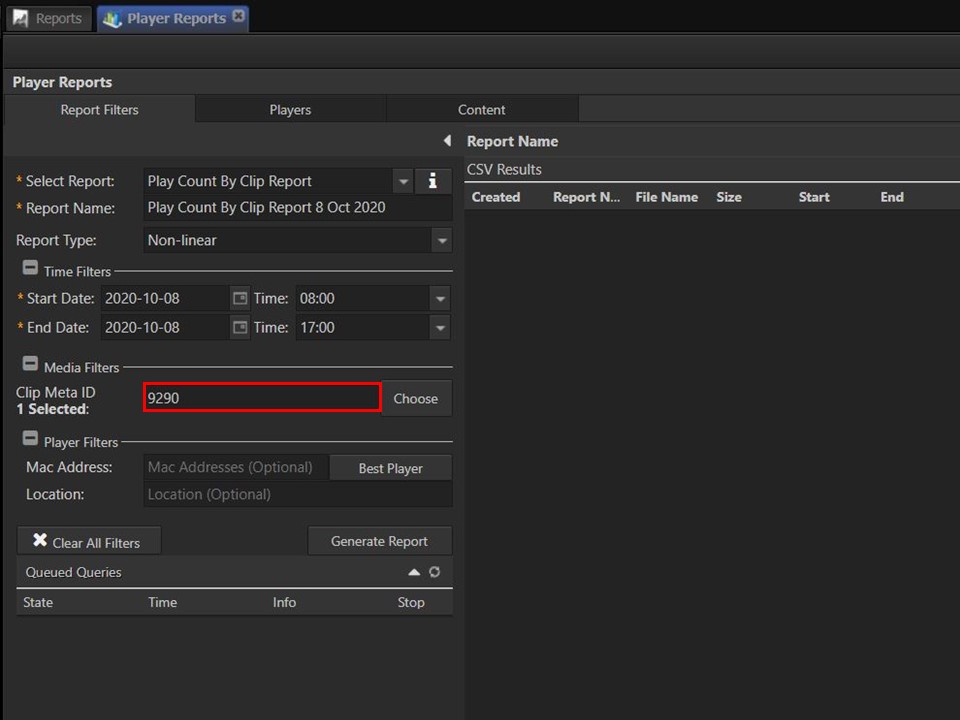
8. You have the option of drawing this report on a single, multiple or all Meta IDs. If you know what the Meta ID is, you can simply type it in the Meta ID field. If you want to include all Meta ID’s, leave the field blank.
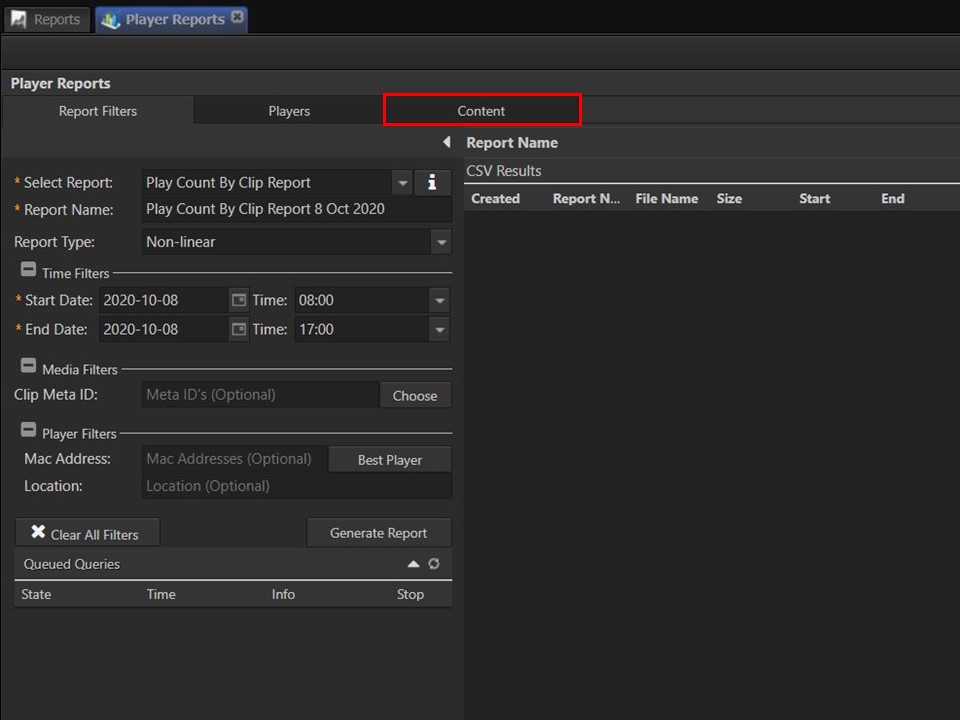
9. Alternatively, click on the Content tab. A window will open.
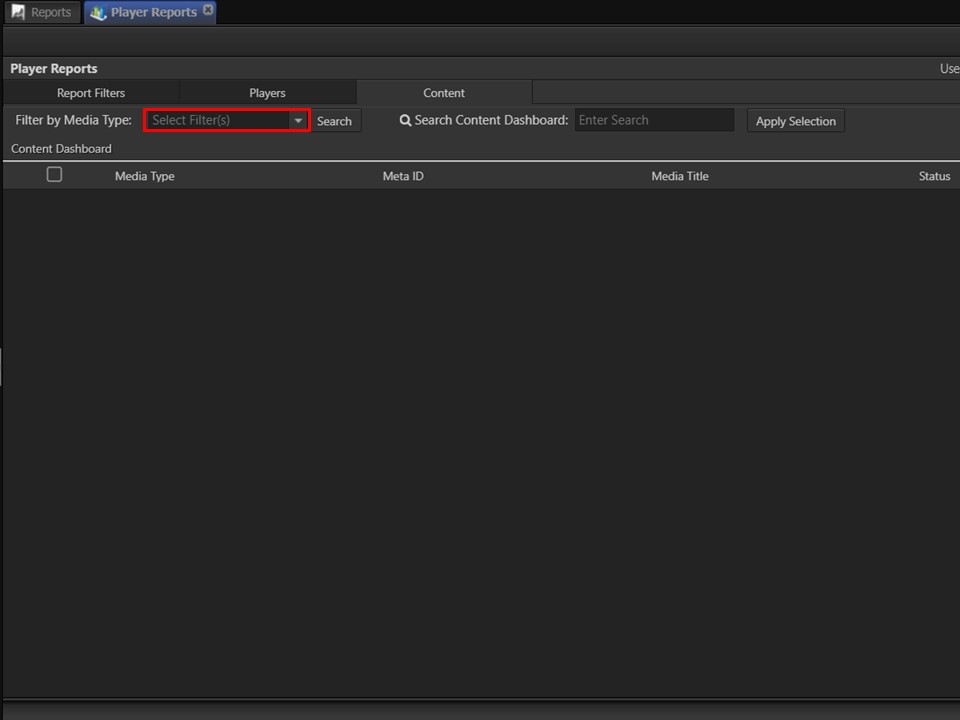
10. Filter by Media Type by selecting from the drop-down and clicking on the Search button. All the content with the Media Type you filtered by, will come up.
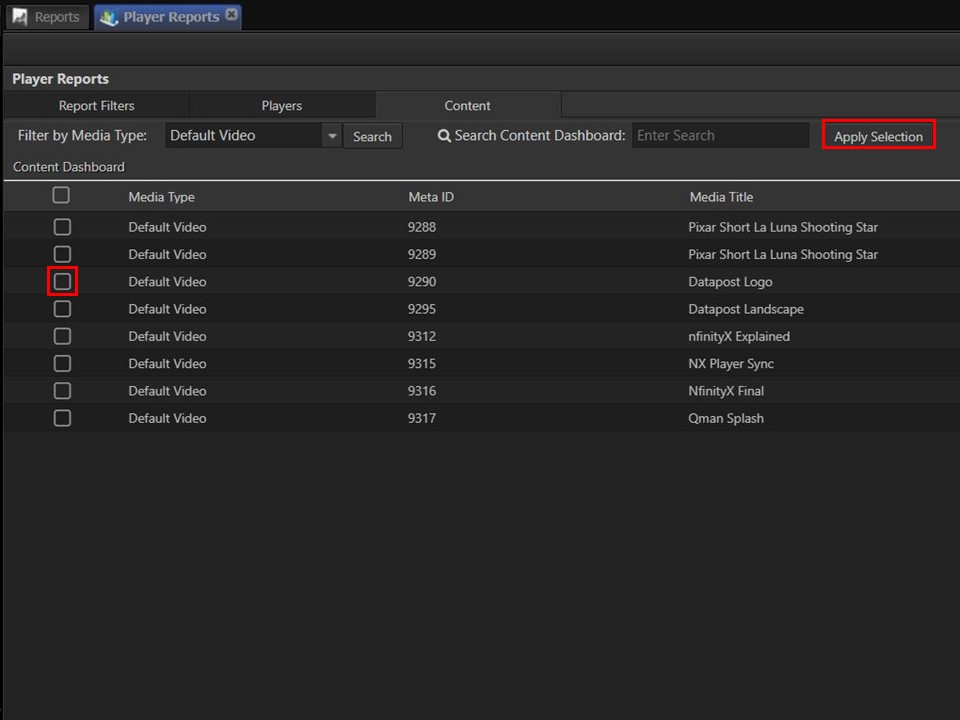
11. Select the relevant Media Title(s) that you want to report on by ticking the box(es) next to it. Click on the Apply Selection button.
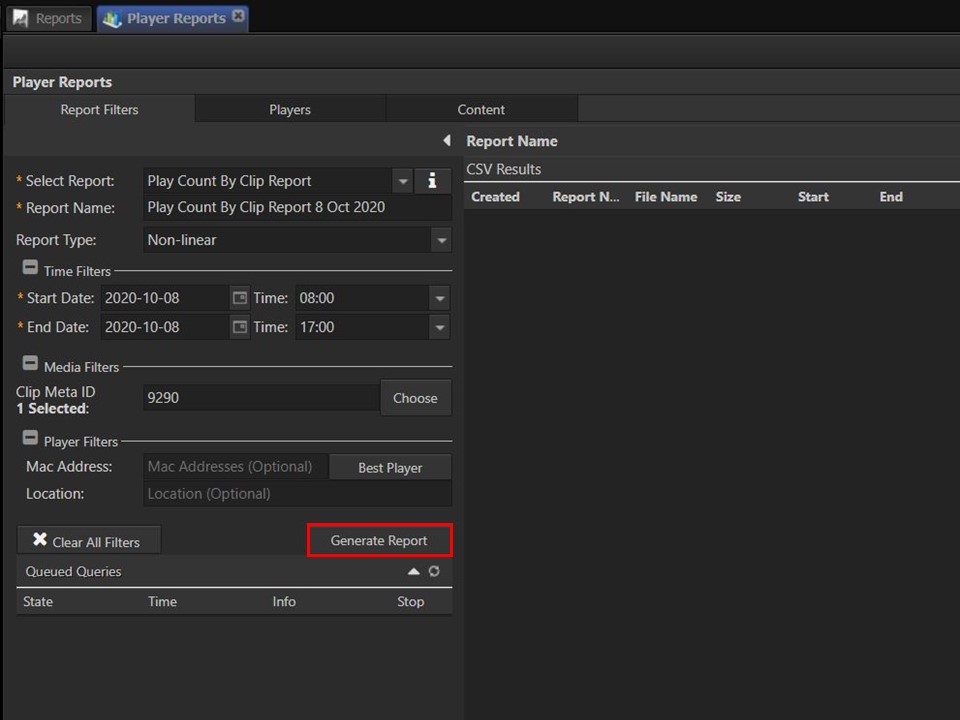
12. Click on the Generate Report button. A window will appear.
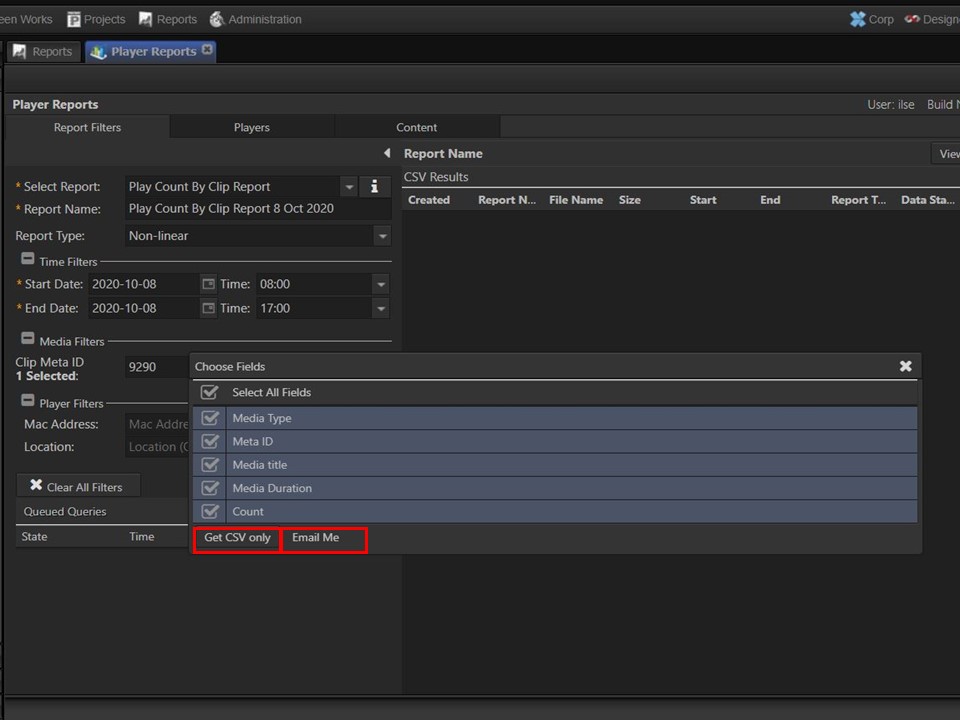
13. Select the fields that you want to add to your report by ticking the boxes. Export the report as a CSV or have it mailed directly to you. Click on the option you prefer. When selecting Email Me, the system will still create a CSV as well.
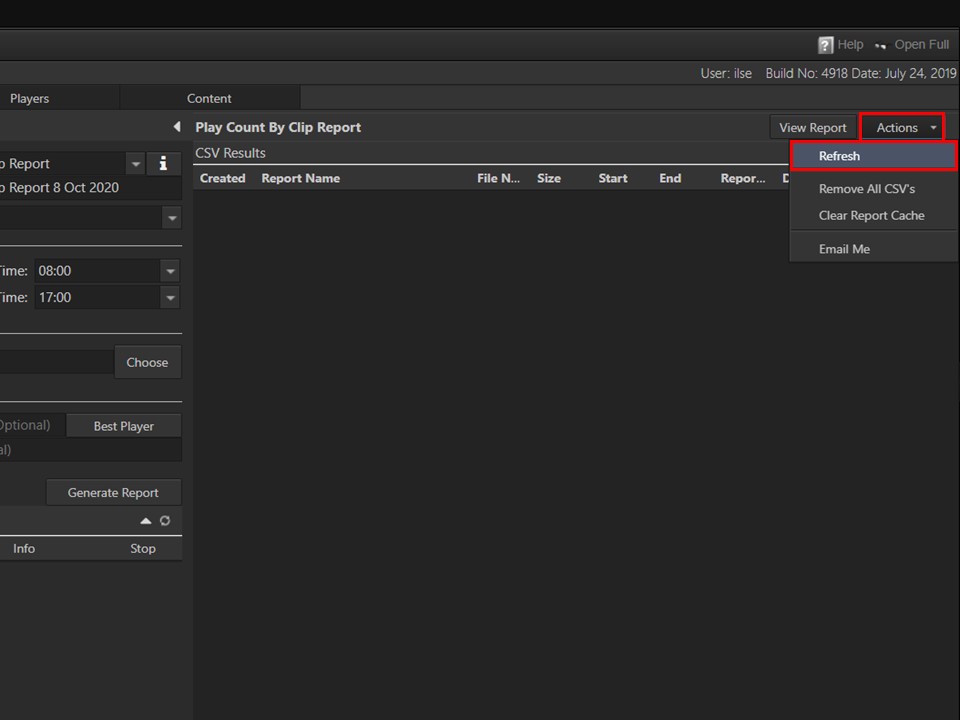
14. Refresh the CSV Results by clicking on the Actions button, followed by Refresh.
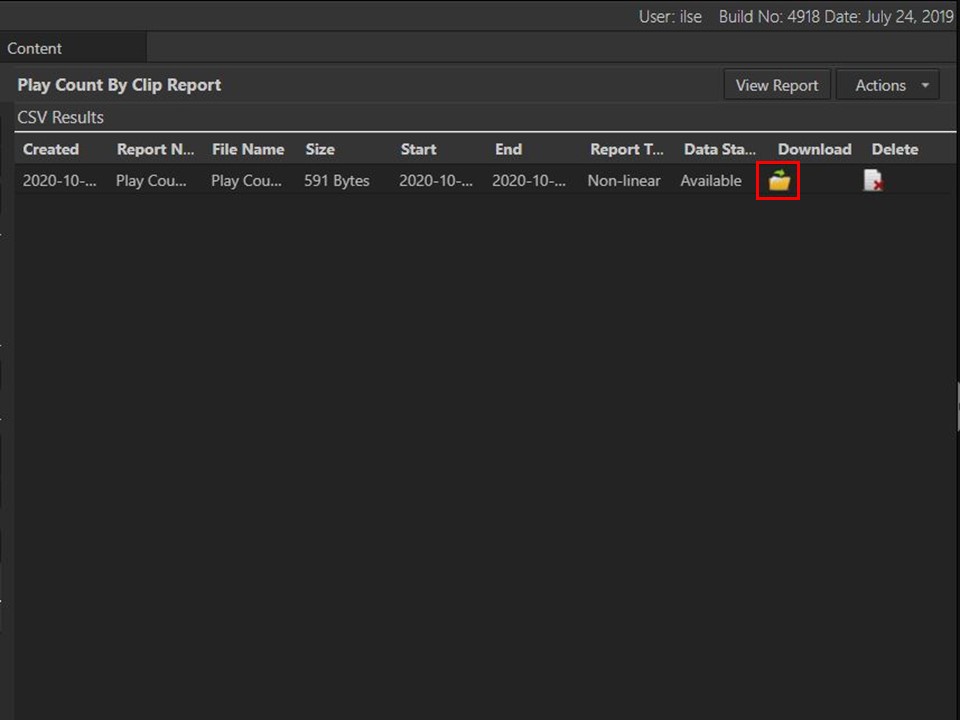
15. The report you have drawn will appear in the panel. Click on the yellow folder to download the CSV to your machine.
Step-by-step guide on how to view a report in the CSV Results panel
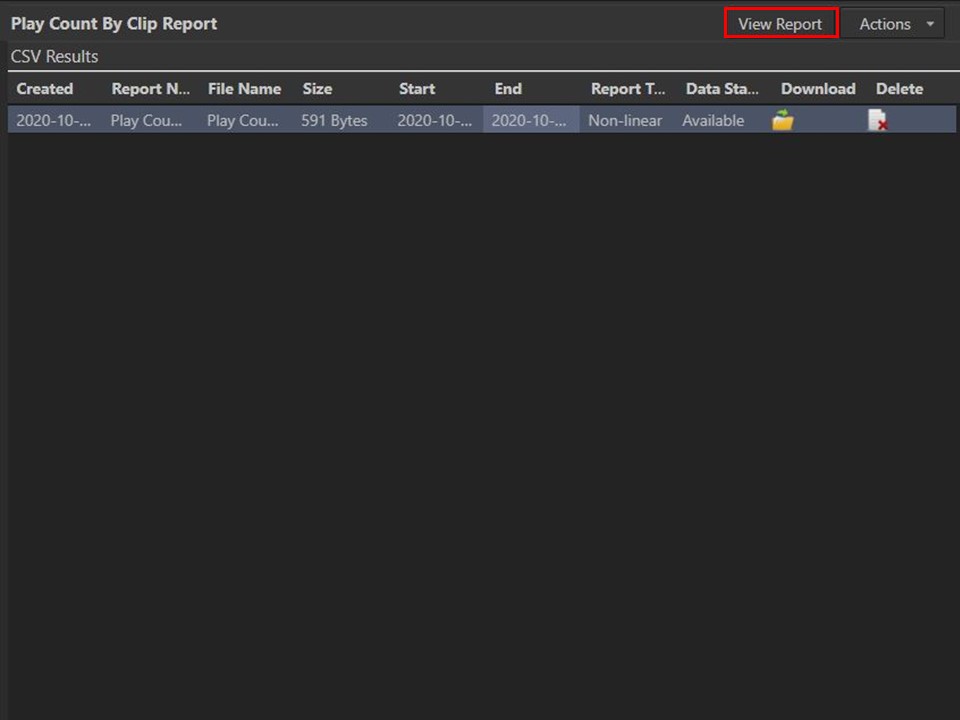
1. Click on the report to select it, once you have refreshed your report in the CSV Results panel. Click on the View Report button.
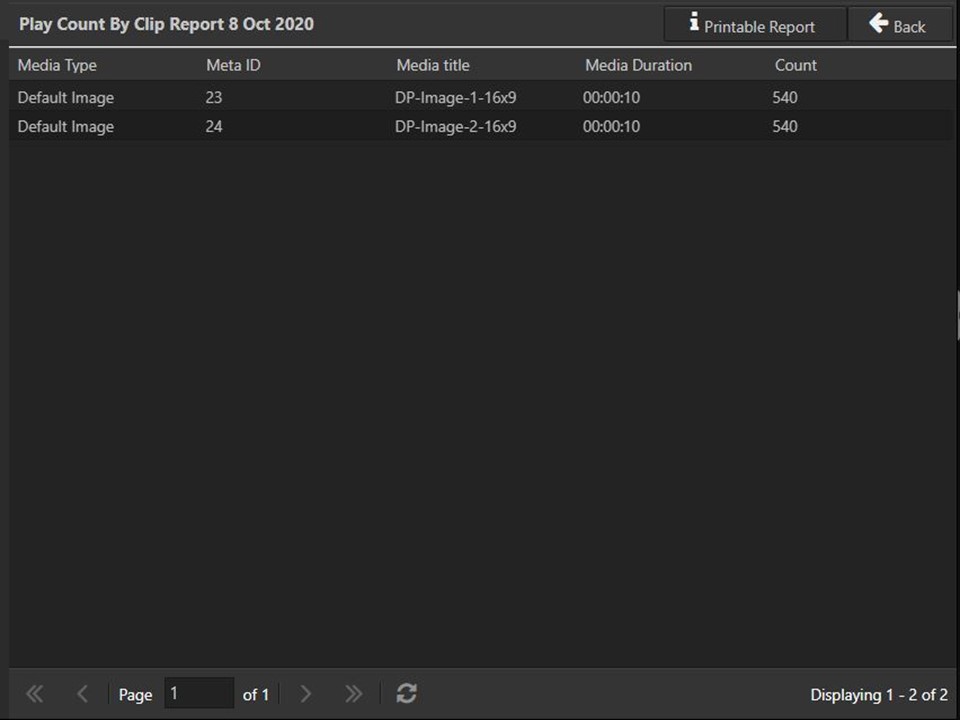
2. The report will open in the CSV Results panel. The Printable Report button will appear.
Step-by-step guide on how to create a printable report
It is important to know that the printable report is only available for the Play Count By Clip Report.
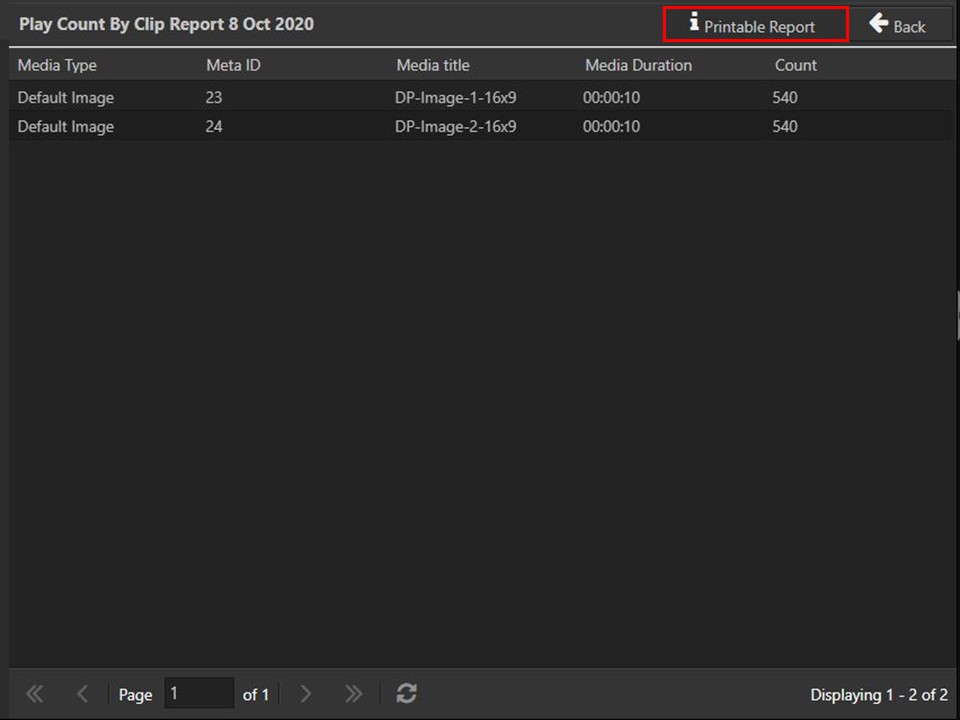
3. Click on the Printable Report button, after clicking on the View Report button.
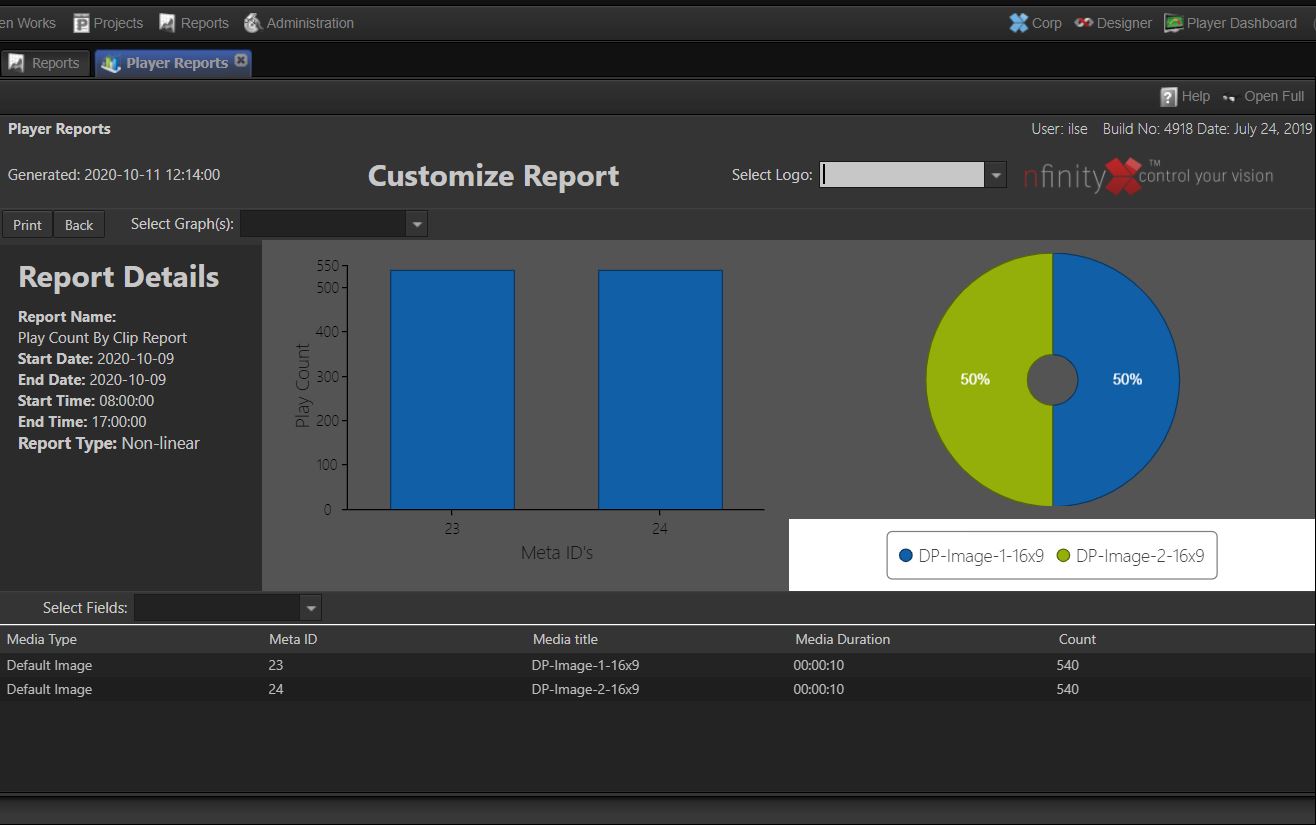
Select Graph(s)
Select the type of graph, you want to include in your printable report, from the Select Graph(s) drop-down. I.e. Column Chart, Pie Chart or both.
Select Fields
Select the available fields, that you want to include in your printable report, from the Select Fields drop-down.
Print button
Click on the print button.
