Qman Manager: Introduction
BackStaff Management
How to add a new user
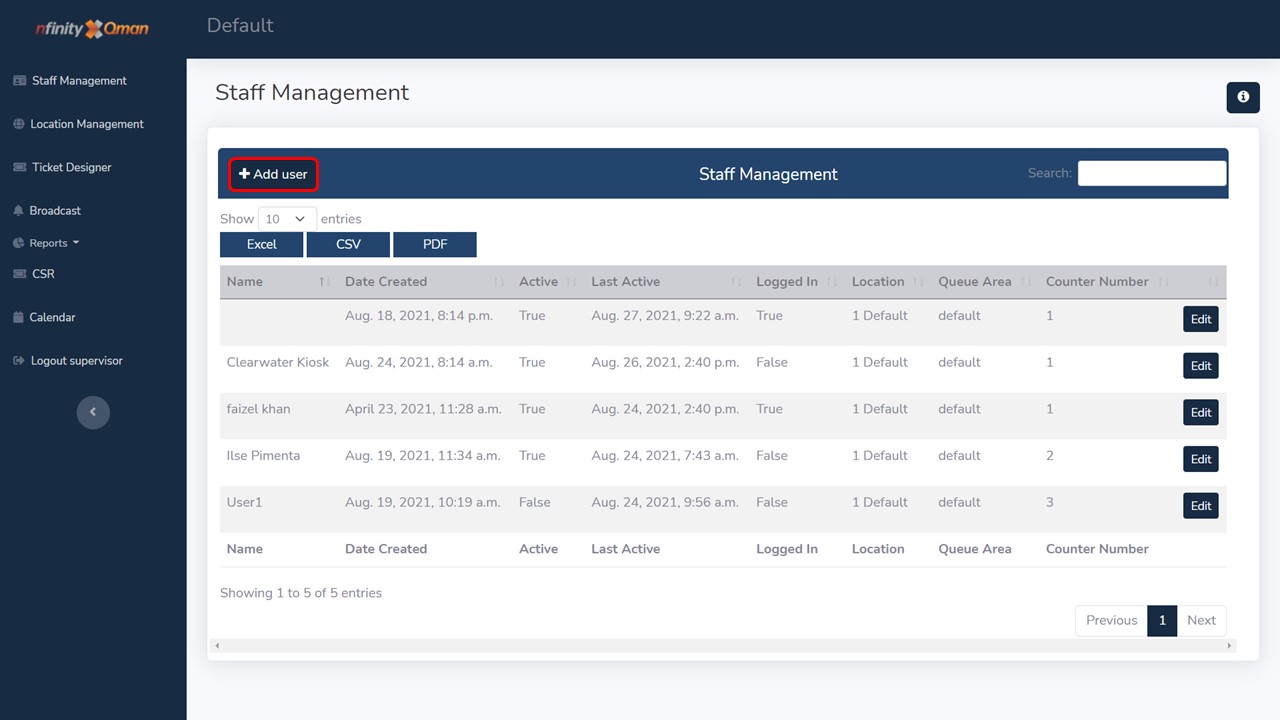
1. Click on the +Add User button.
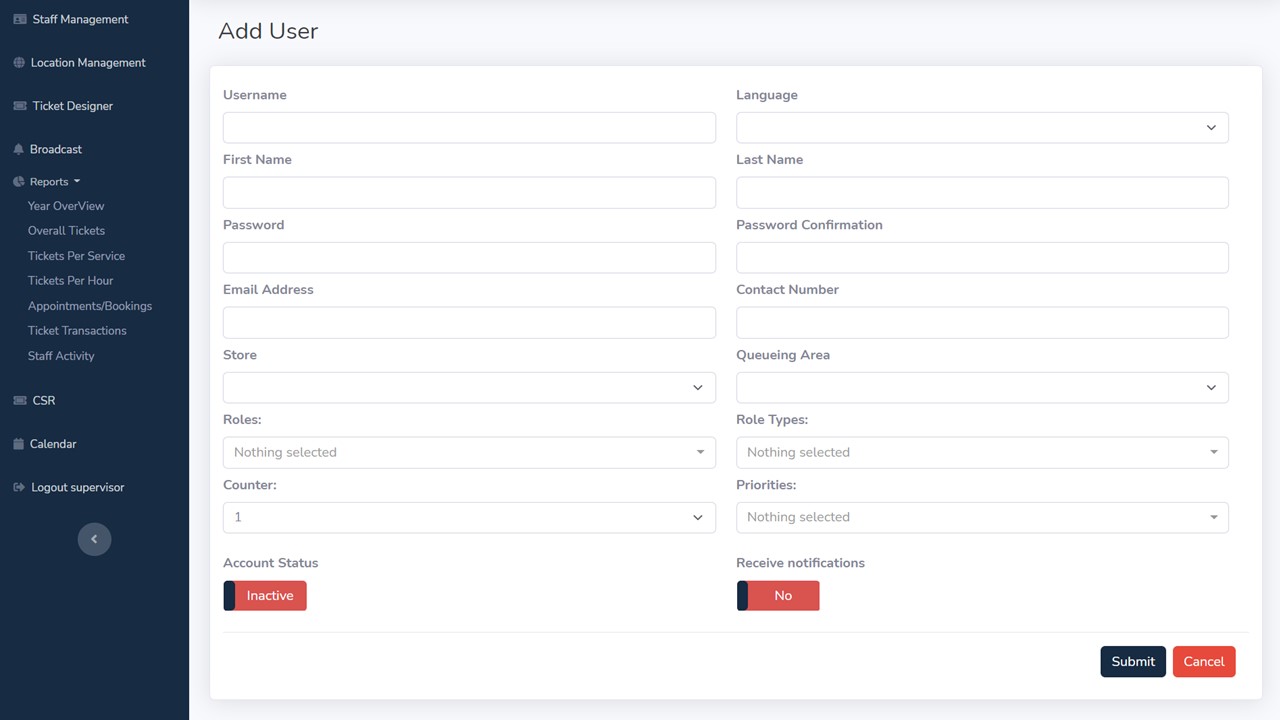
2. Complete the form.
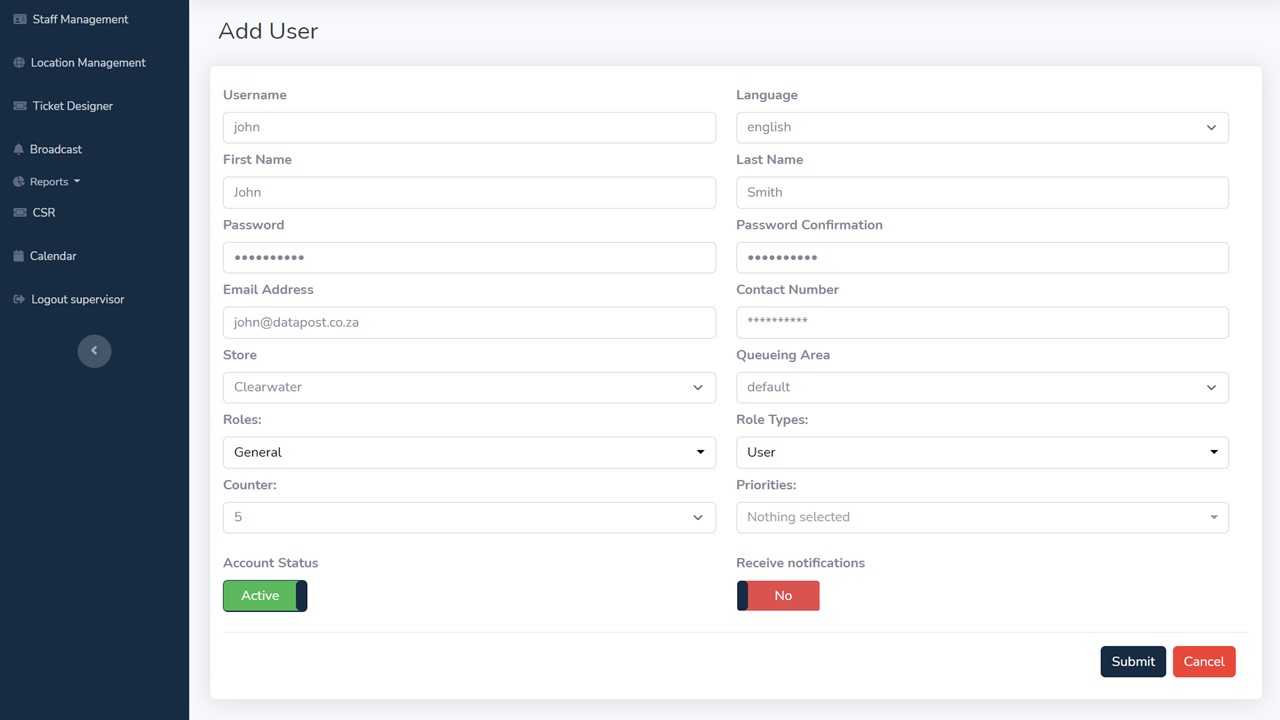
3. Move the Account Status slider to the right to change the user’s account status from inactive to active.
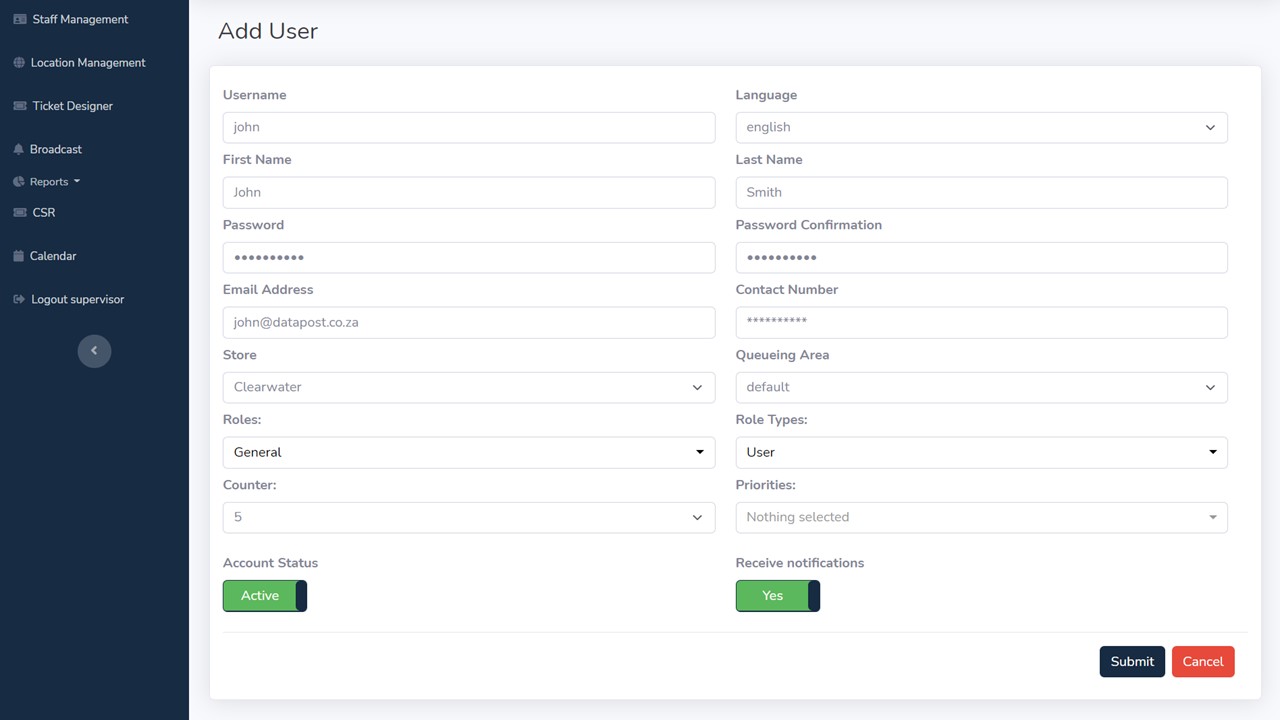
4. Move the Receive notifications slider to the right to enable the user’s notifications.
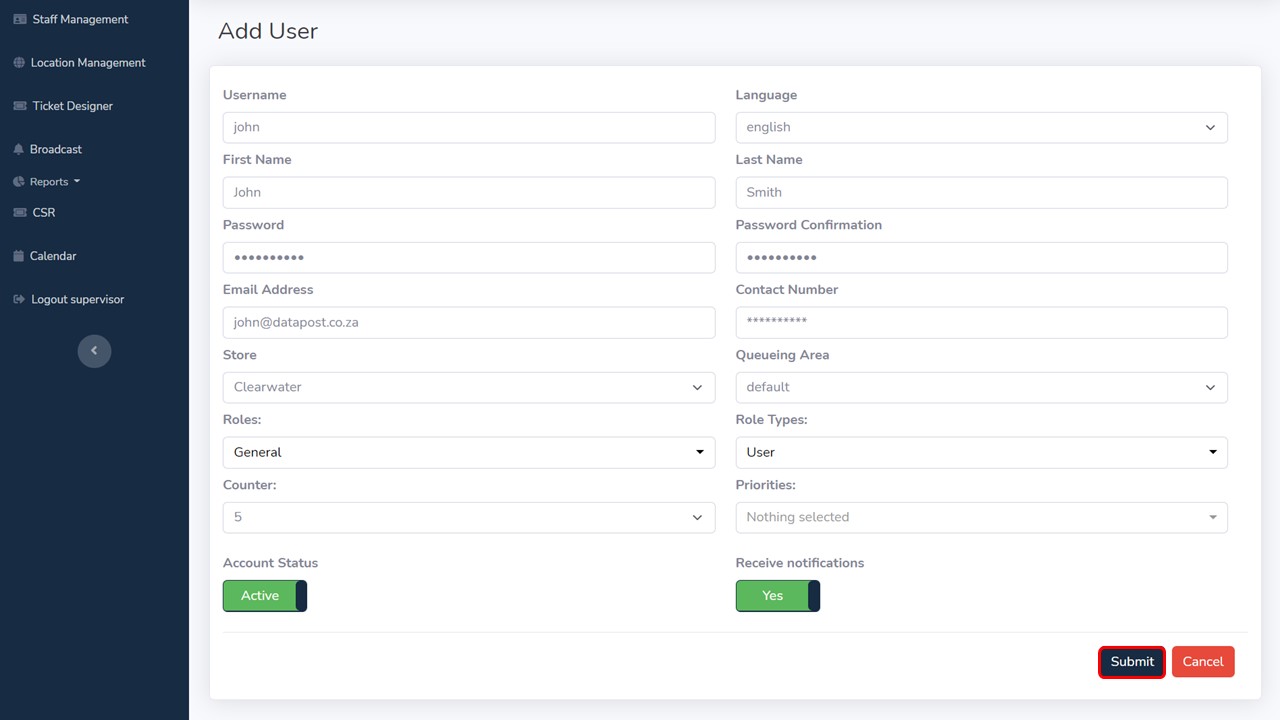
5. Click on the Submit button to save.
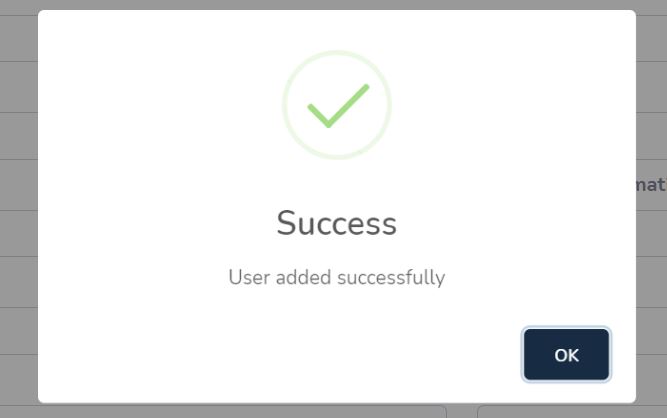
6. A message will pop up confirming the success of adding a new user. Click on OK.
How to edit a user
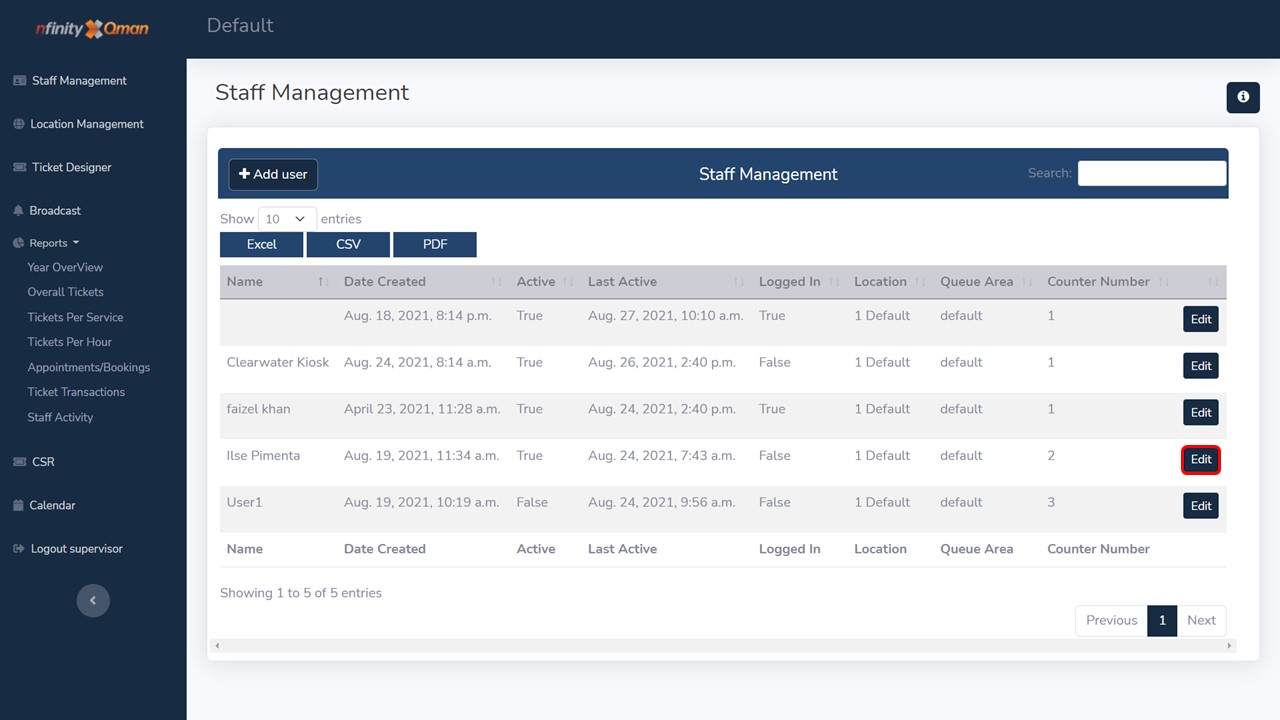
1. Click on the Edit button next to the user that you want to edit.
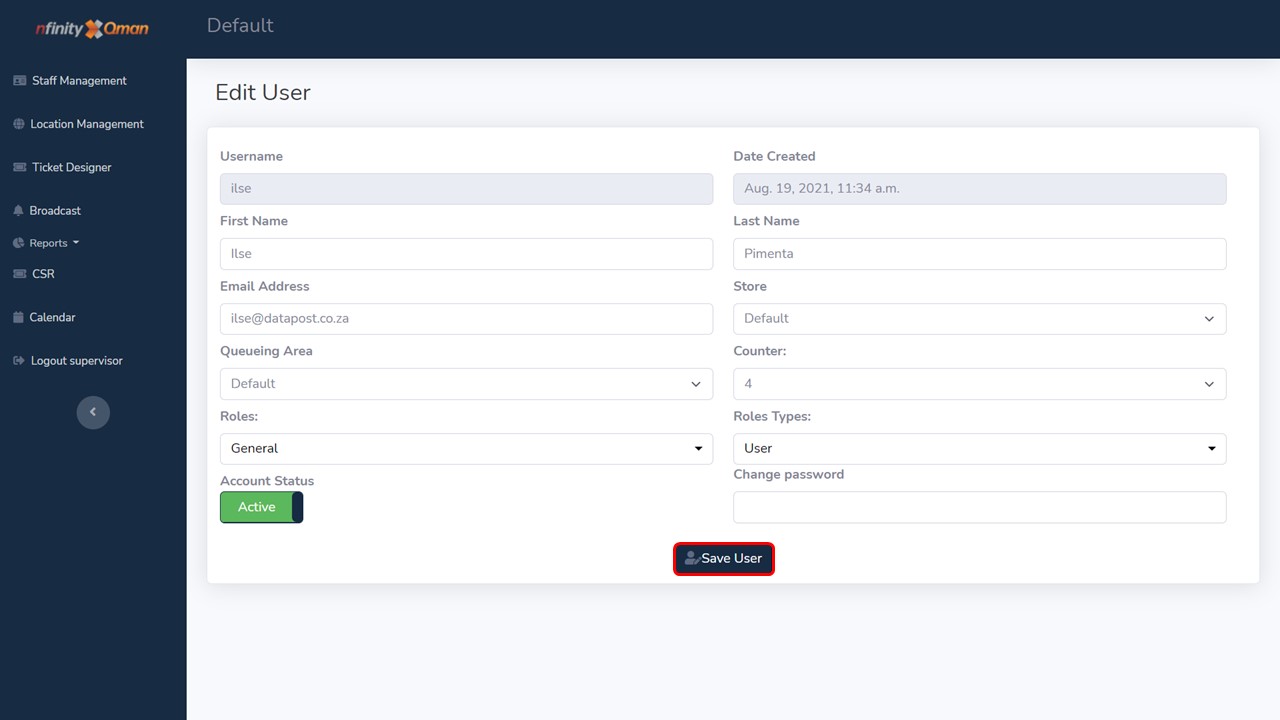
2. Change the information that you want to change and click on the Save User button.
How to inactivate a user account

1. Click on the Edit button.
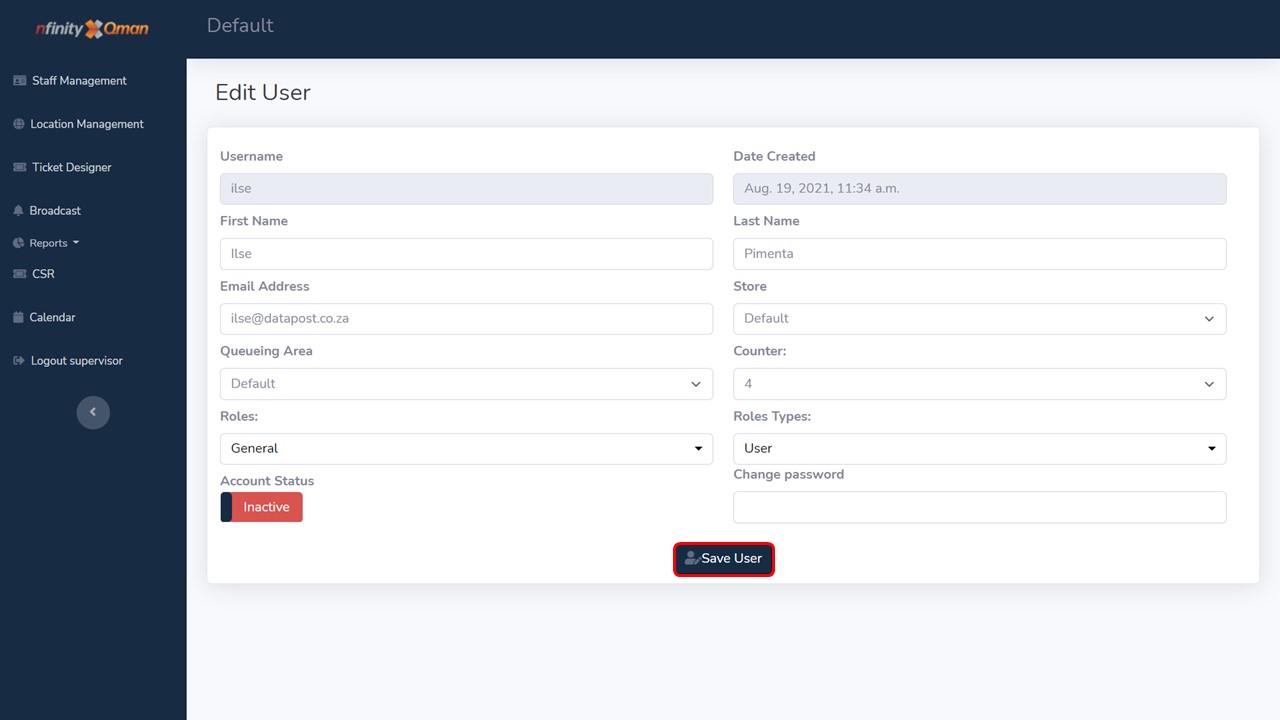
2. Move the Account Status slider to the left and click on the Save User button.
Location Management
How to add a Branch Config
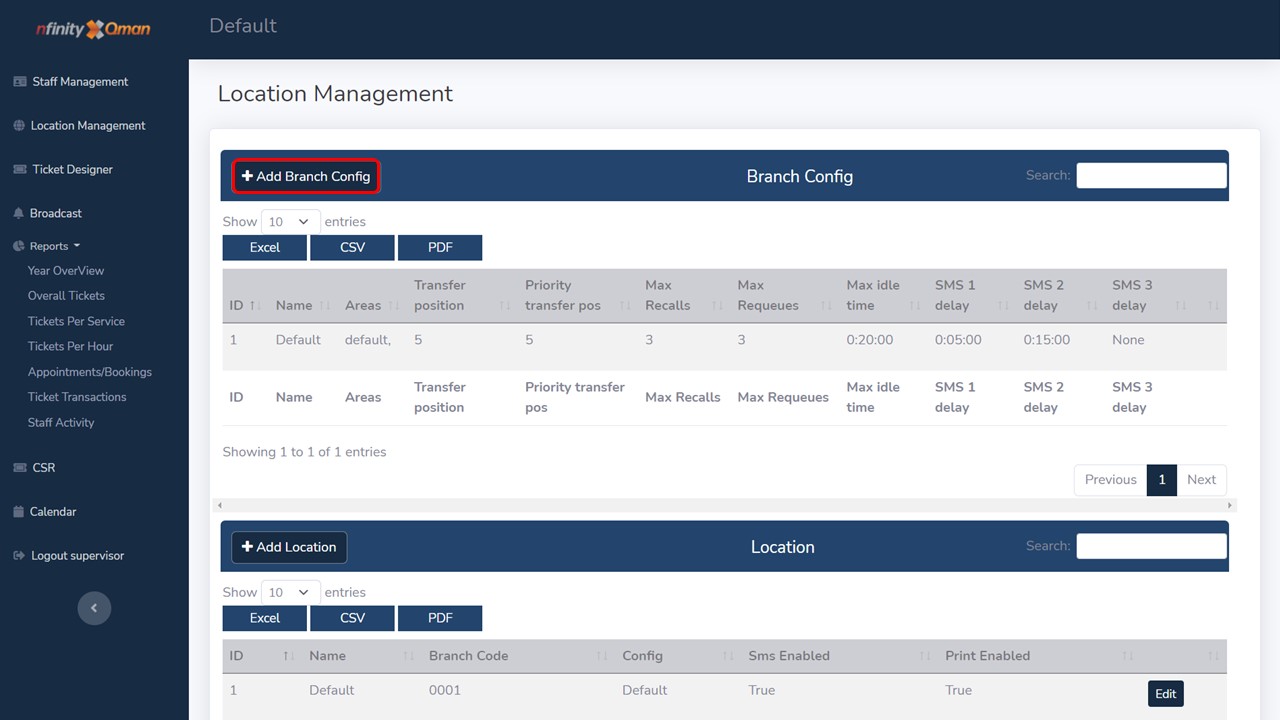
1. Click on the +Add Branch Config button.
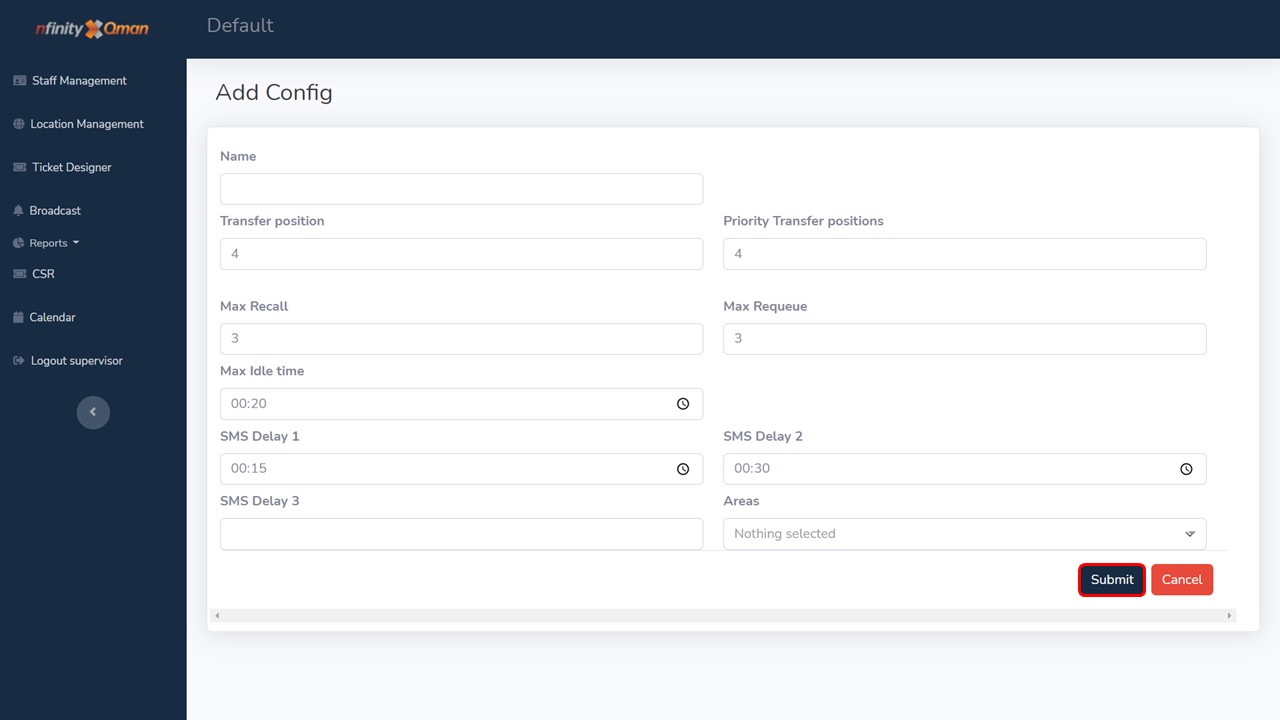
2. Complete the fields and click on the Submit button.
Branch config fields explained
Name
The name of the new branch/store that is being added.
Transfer Position
The number of spaces the ticket will move back in the queue, when being transferred.
Priority Transfer Positions
The number of spaces the ticket will move back in the queue, when being transferred, because of the set priority. The number will be lower than for the transfer position.
Max Recall
The maximum number of times a ticket can be called before it is re-queued.
Max Re-queue
The maximum number of times a ticket can be re-queued before it is classified as a No Show.
Max Idle Time
The maximum interval between e-mail alerts.
SMS Delay 1
The interval at which the first SMS is sent.
SMS Delay 2
The interval at which the second SMS is sent.
SMS Delay 3
The interval at which the third SMS is sent.
Areas
The available areas in the branch/store that are being added.
How to add a Location
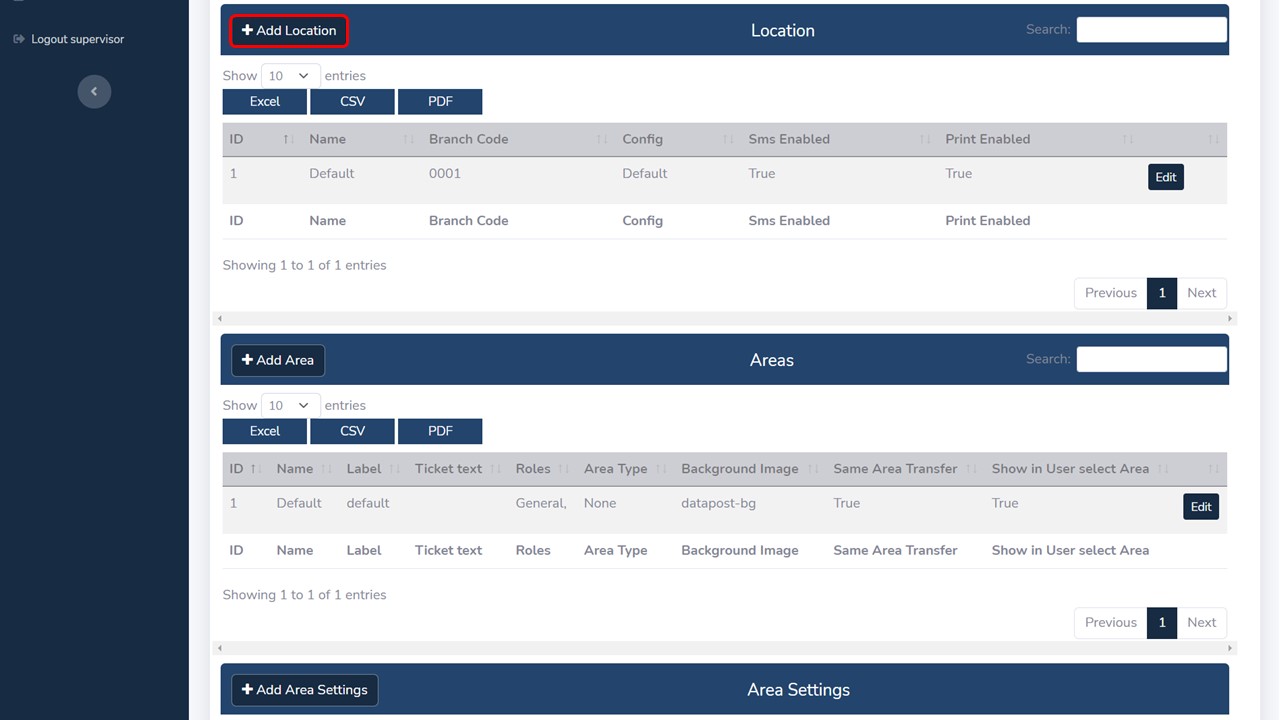
1. Click on the Add Location button.
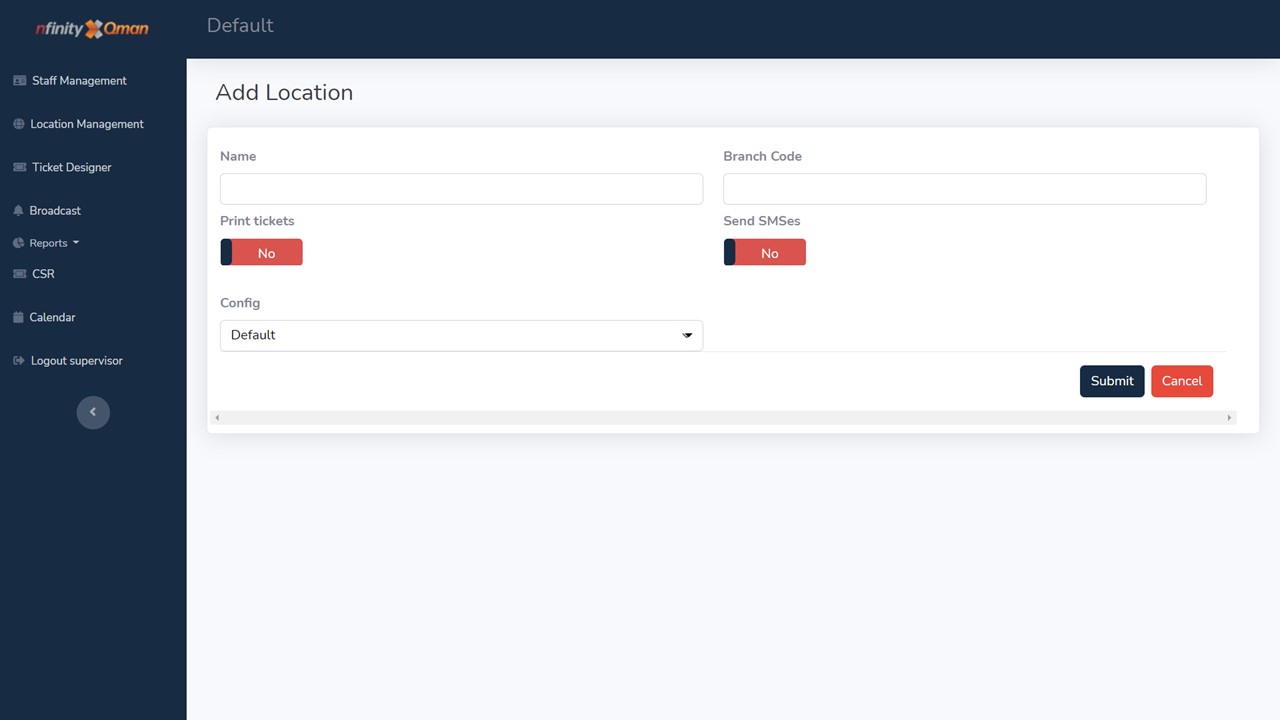
2. Complete the name and branch code of the new location.
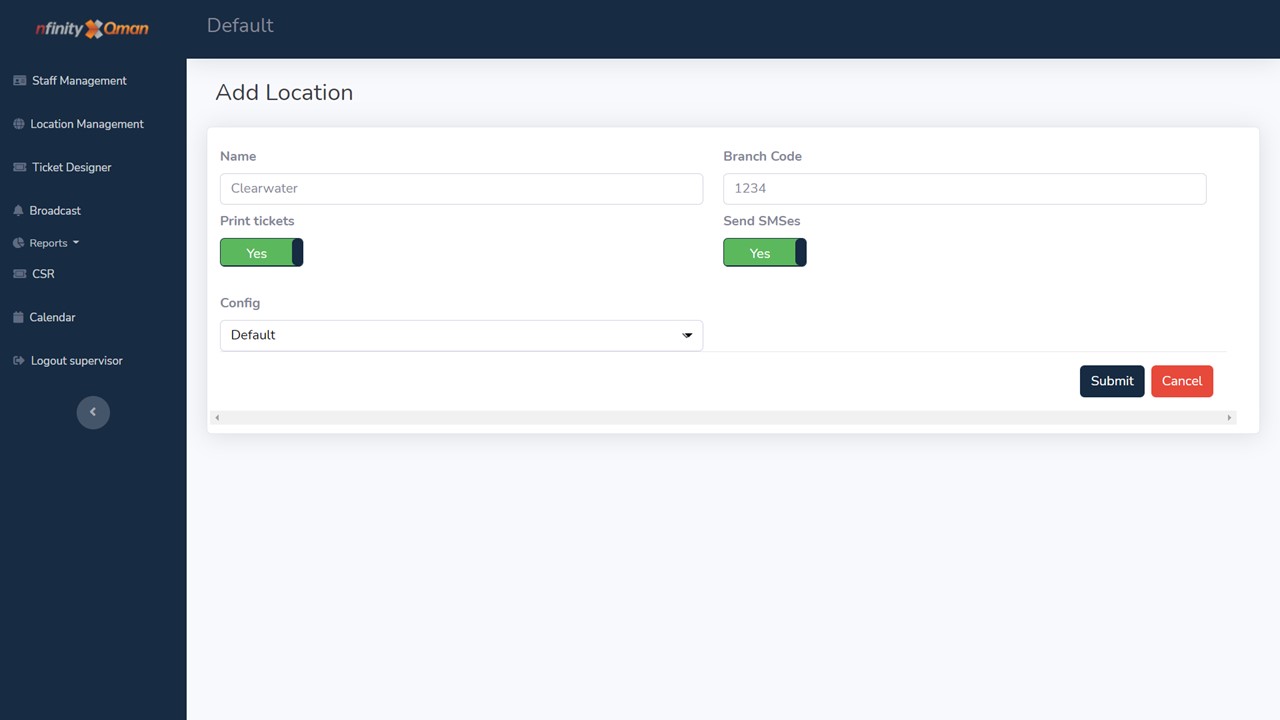
3. Move the Print tickets and/or Send SMSes sliders to the right as required.
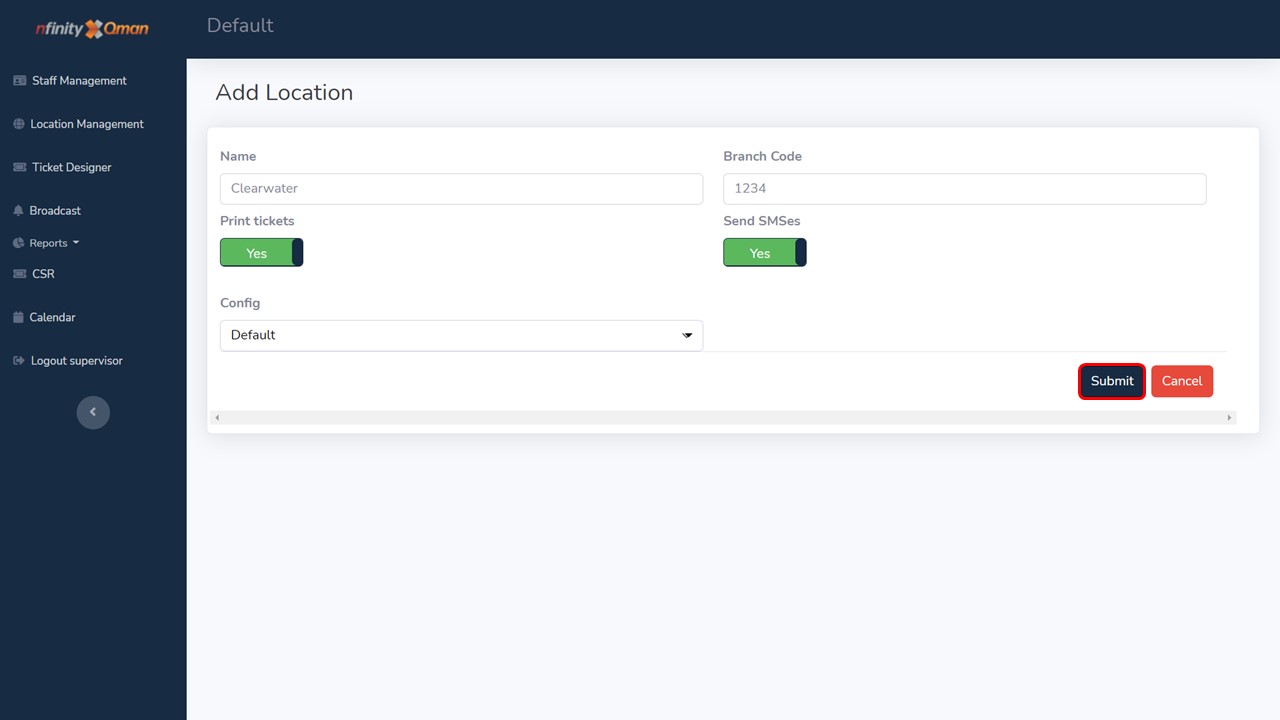
4. Select the relevant config from the drop-down and click on the Submit button.
How to edit a location
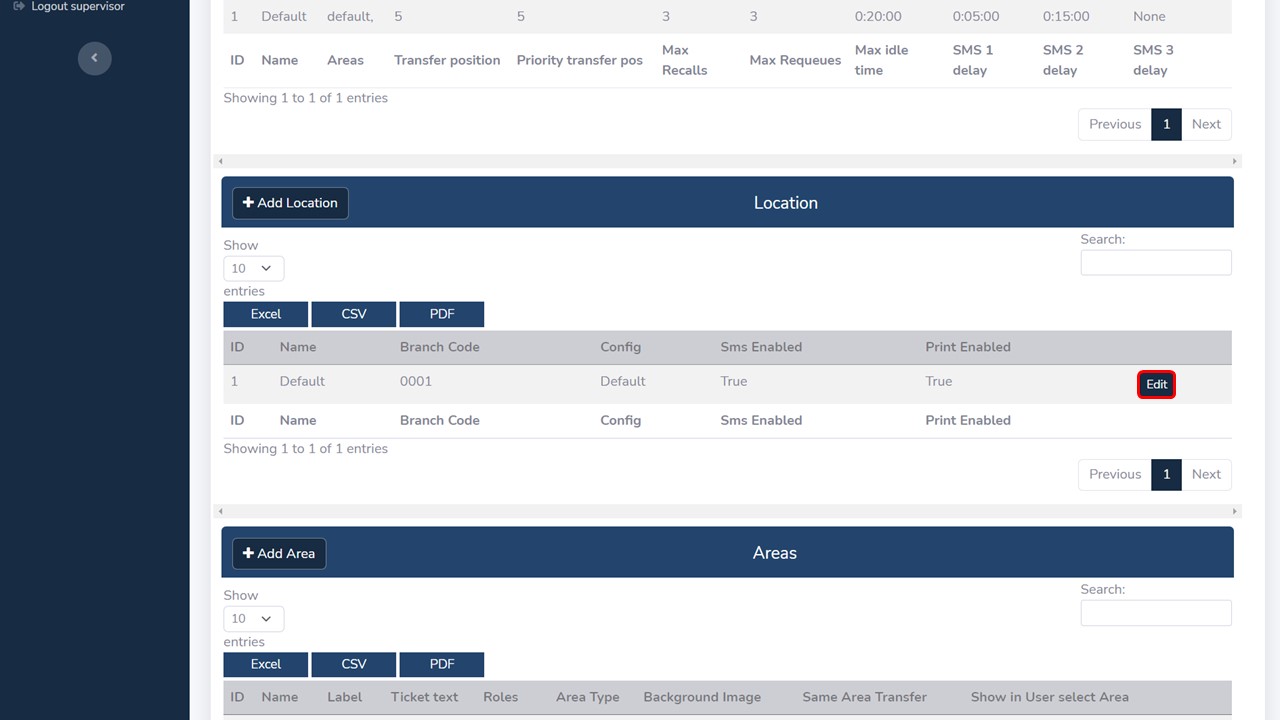
1. Click on the Edit button next to the relevant location.
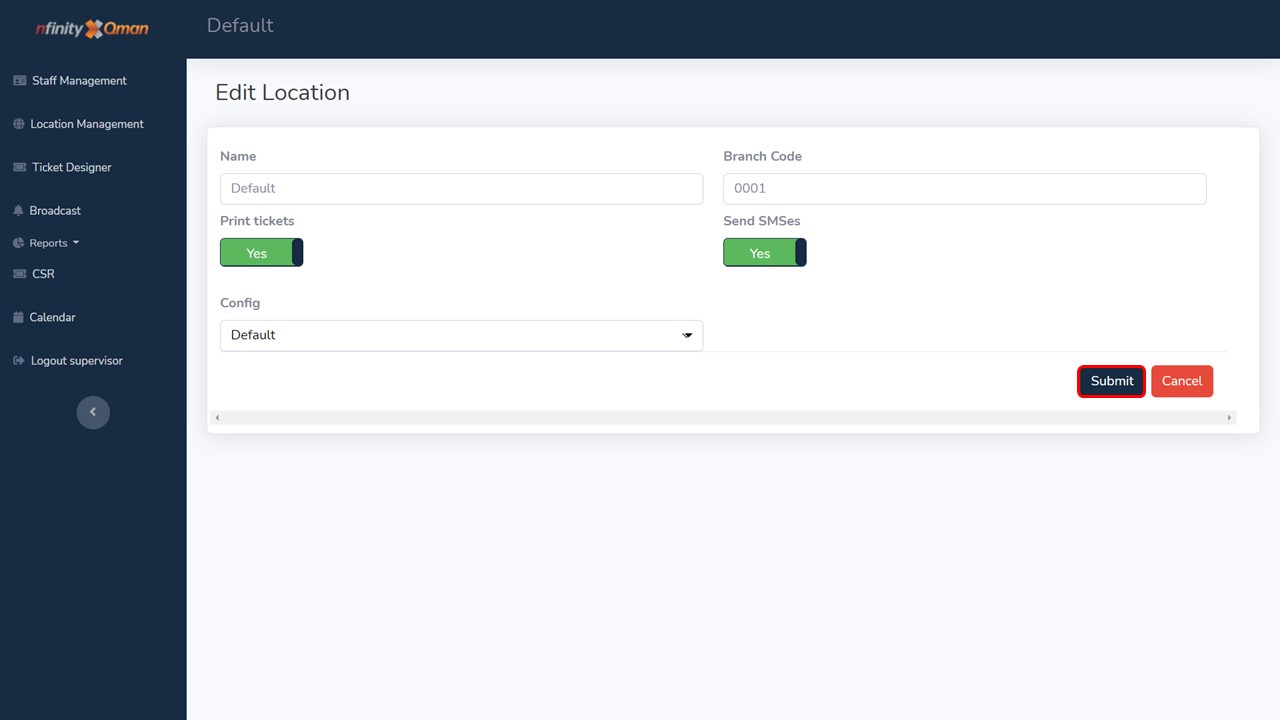
2. Change the information that you want to change and click on the Submit button.
How to add an Area
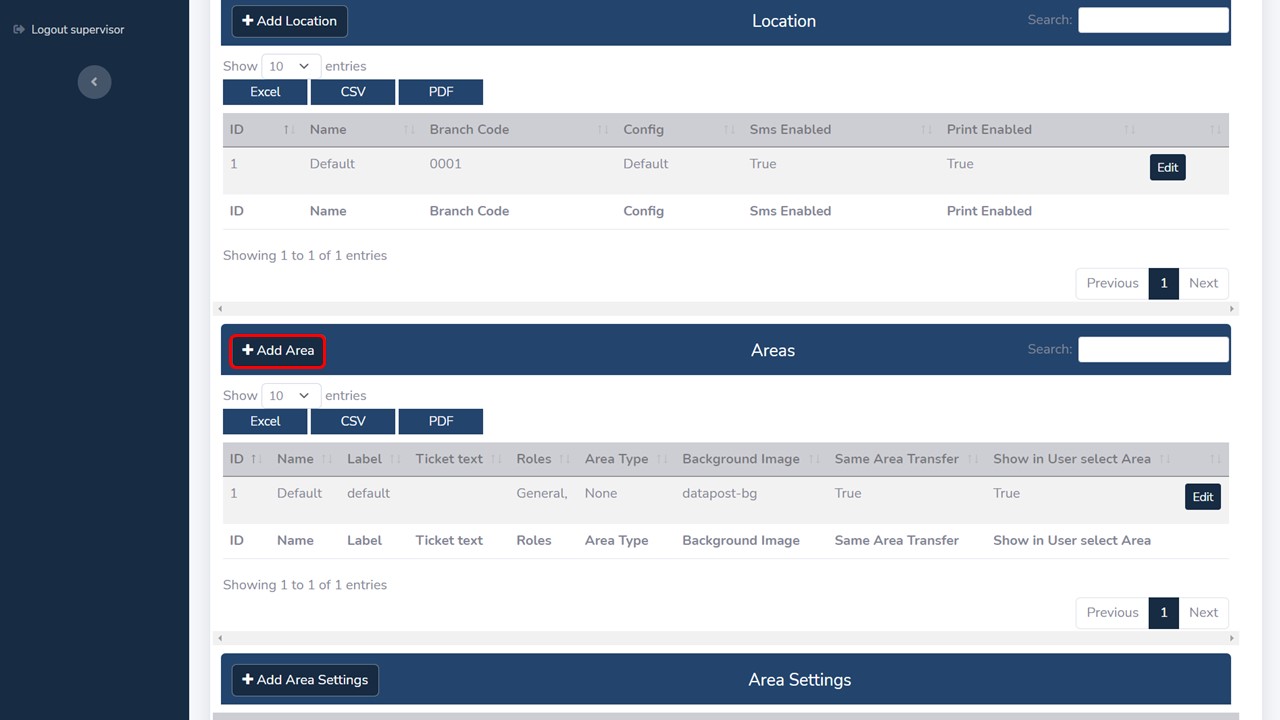
1. Click on the +Add Area button.
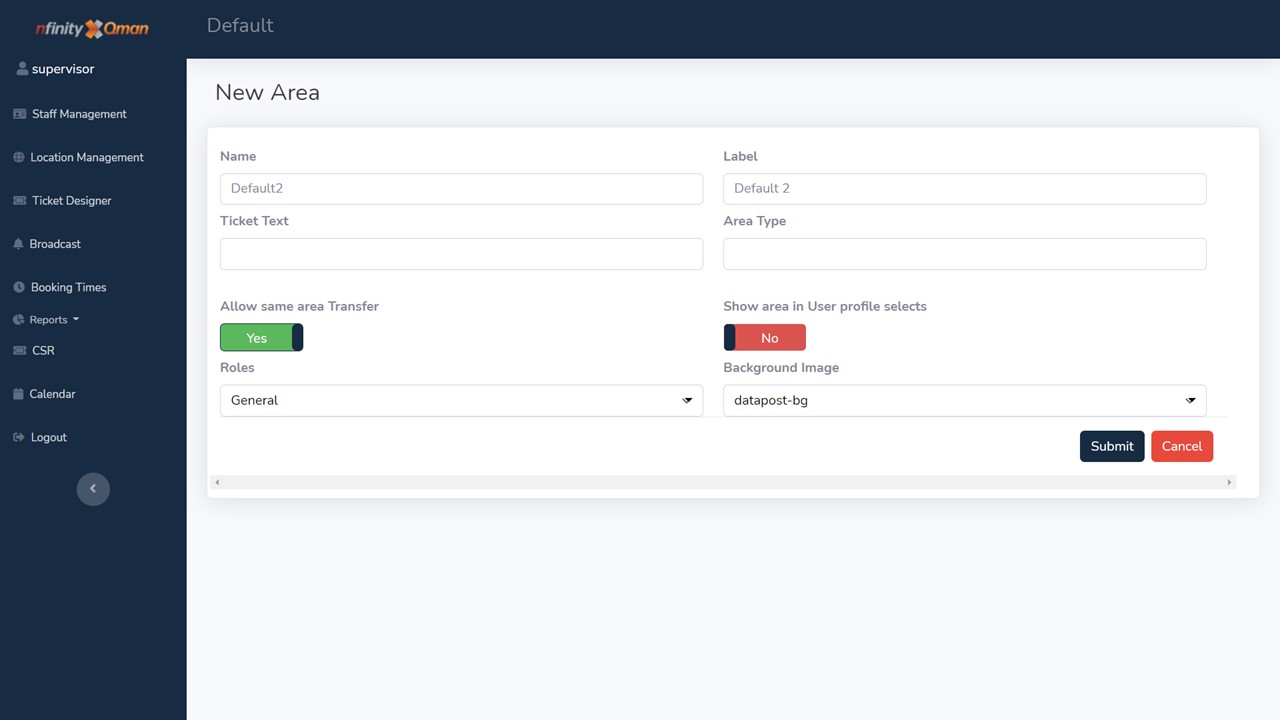
2. Complete the form.
New area fields explained
Name
The system area name.
Label
The area name displayed on the interface.
Ticket Text
Text that will be displayed on the ticket.
Area Type
The type of area being added.
Allow same area transfer
This allows a consultant to transfer a ticket to another consultant in the same area, if a different service is required to resolve the ticket.
Show area in user profile selects
This field has to be set to yes for the area to display in the profile drop-down.
Roles
The roles that will be fulfilled in the area.
Background Image
The background image that is displayed on the kiosk. This image is set by an administrator.
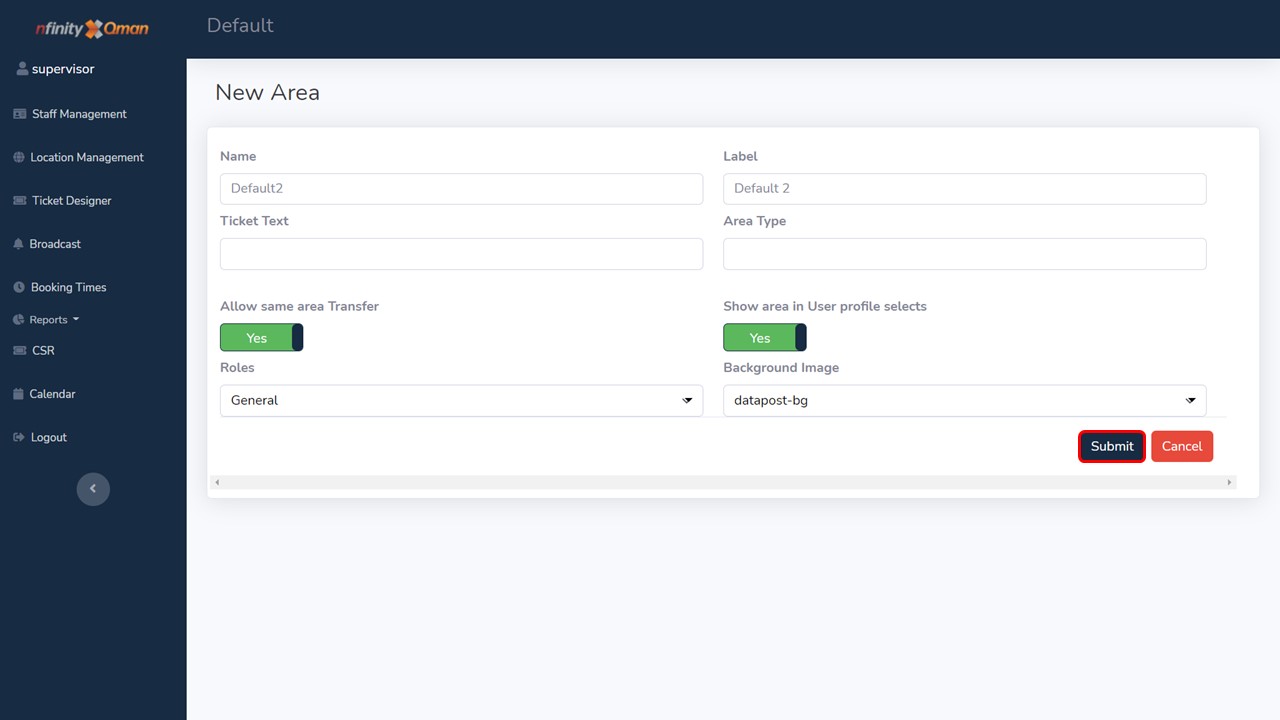
3. Move the Show area in User profile selects slider to the right to set it to Yes & click on Submit.
How to edit an area
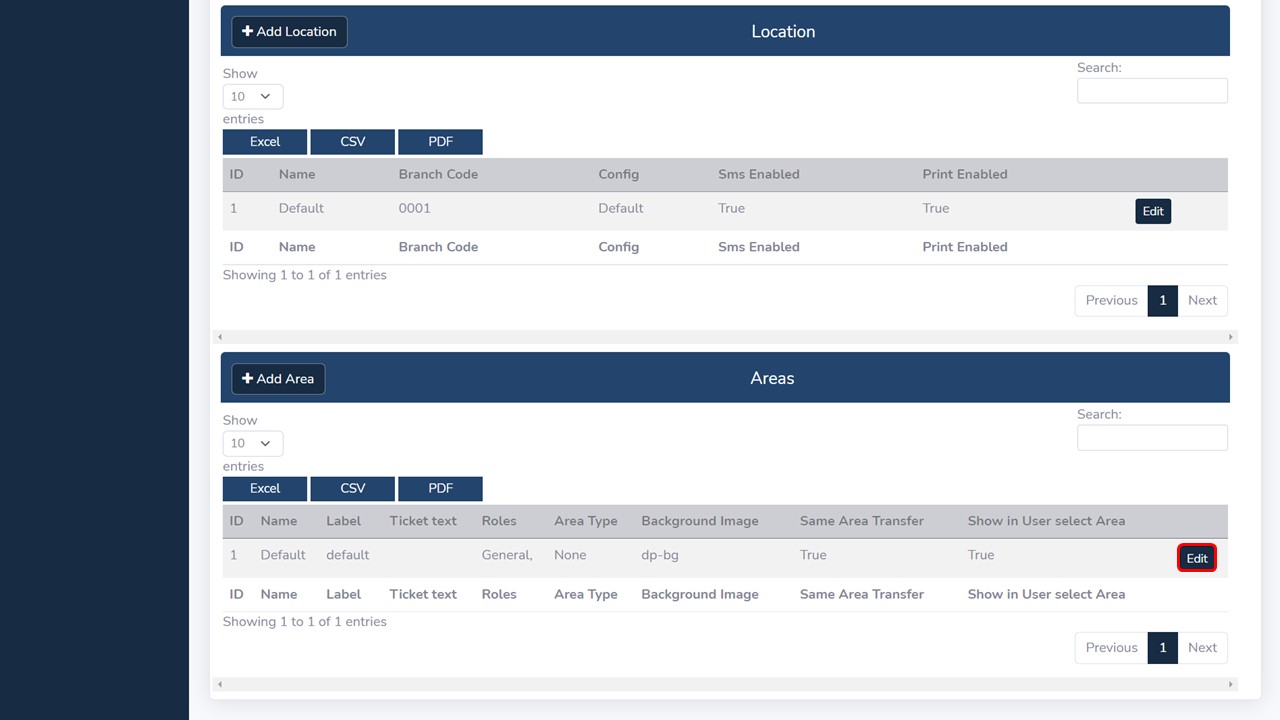
1. Click on the Edit button next to the area that you would like to edit.
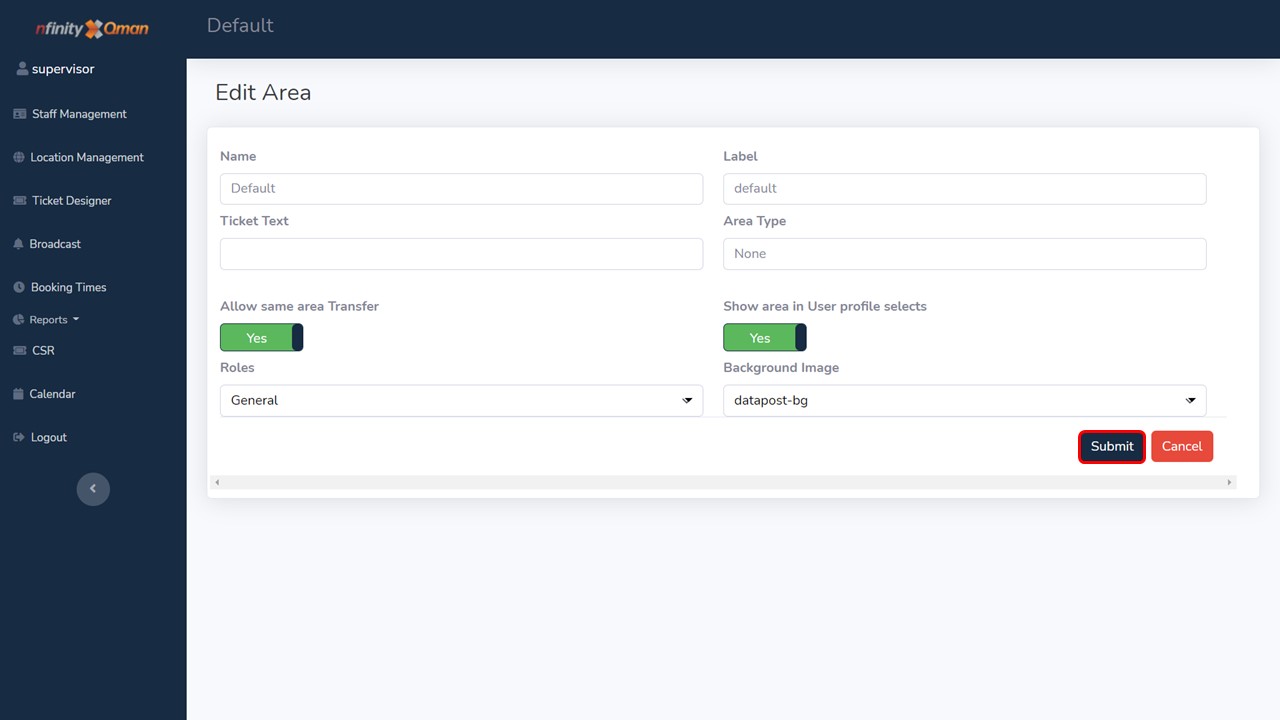
2. Change the information that you want to change and click Submit.
How to export a list of branch configs, locations or areas
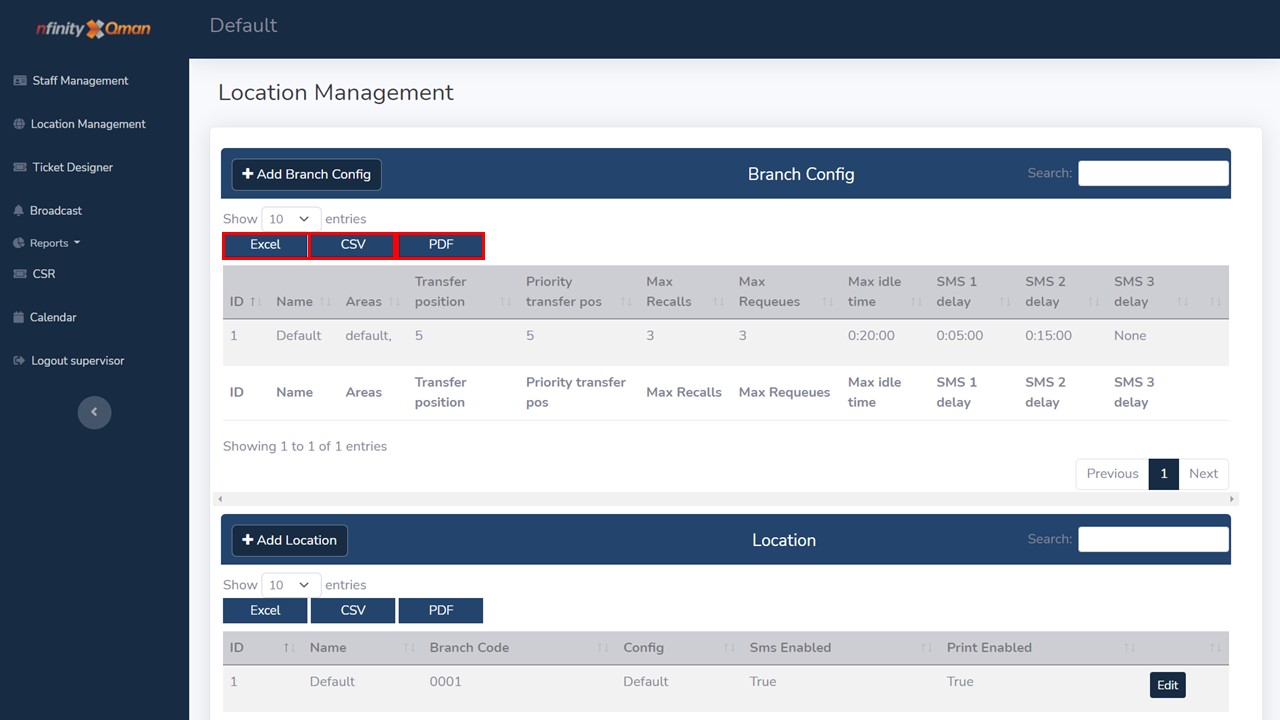
1. Click on the relevant format, in the relevant section, in which you want to receive the exported list. The options are Excel, csv & pdf.
Broadcast
How to send a broadcast message
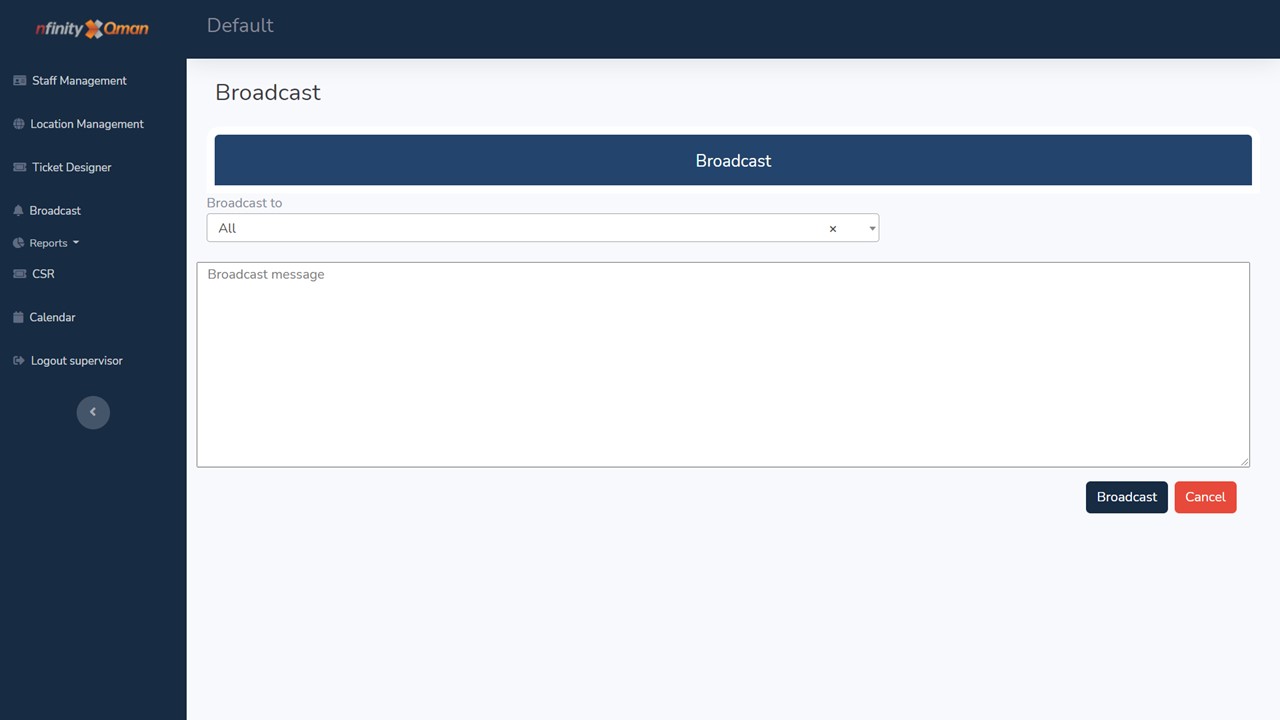
1. Select the user that you, as a supervisor, want to broadcast to from the drop-down & type the message in the Broadcast message box.
If it’s a message that must be broadcast to all the users, you will select All.
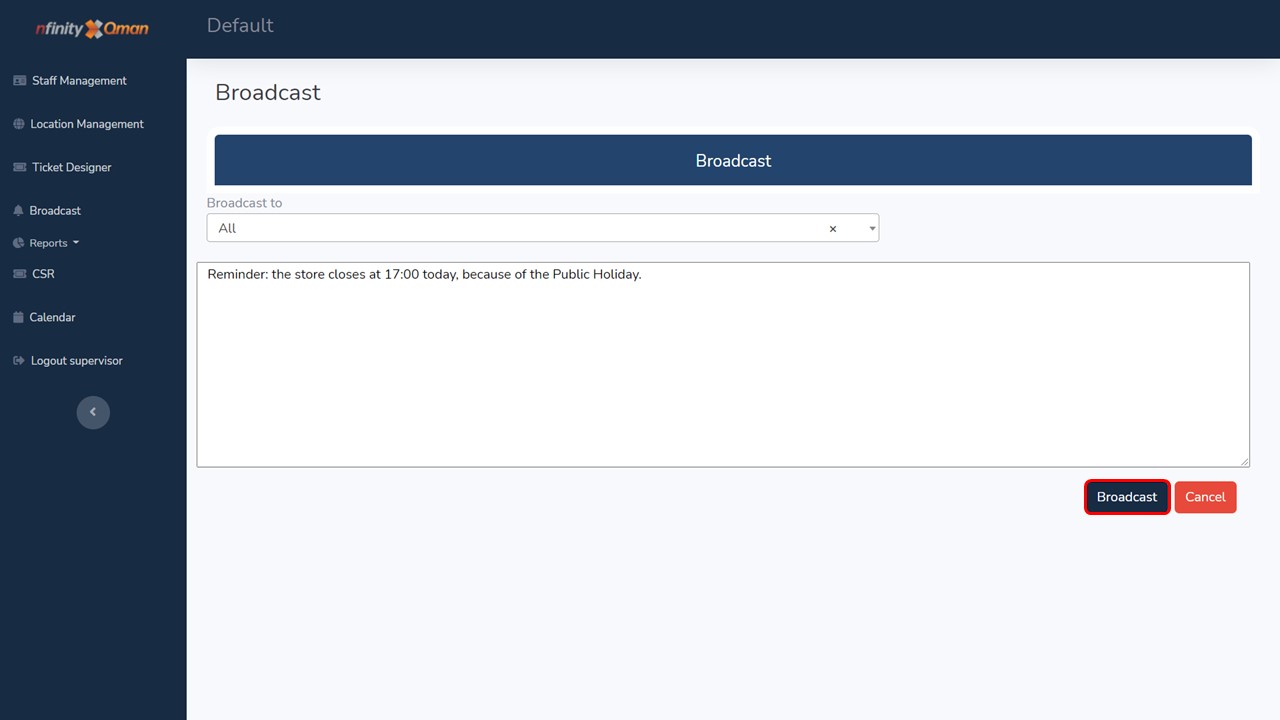
2. Click on the Broadcast button.
Reports
Year Overview
Tickets Per Month
A graph displaying the number of tickets served per month for the current year & selected location.
Tickets
The total number of tickets served for the current year & selected location.
Appointments
The total number of appointments for the current year & selected location.
Consultants
The total number of consultants for the current year & selected location.
Top 5 Services
A graph displaying the top 5 services for the current year & selected location in terms of tickets served.
Overall Tickets
Week
A breakdown of the overall number of tickets, walk-in’s & appointments for the selected week & location.
Week %
A breakdown of the overall number of tickets, walk-in’s & appointments for the selected week & location, also expressed as percentages.
Month
A breakdown of the overall number of tickets, walk-in’s & appointments for the selected month & location.
Month %
A breakdown of the overall number of tickets, walk-in’s & appointments for the selected month & location, also expressed as percentages.
Year
A breakdown of the overall number of tickets, walk-in’s & appointments for the selected year & location.
Year %
A breakdown of the overall number of tickets, walk-in’s & appointments for the selected year & location, also expressed as percentages.
Tickets Per Service
Tickets Per Service
A graph displaying the number of tickets per service for the selected location & date range.
Service Statistics
A table listing the services, the overall number of tickets per service (also expressed as a %) as well as, the number of walk-in’s and bookings (also expressed as a %) for the selected location & date range.
Tickets Per Hour
Tickets Created Per Hour
A graph displaying the number of tickets that were generated per hour at the selected location during the selected date range.
Tickets Closed Per Hour
A graph displaying the number of tickets that were closed per hour at the selected location during the selected date range.
Appointments/Bookings
Total
The total number of bookings made for the selected location & date range.
Attended
The number of bookings that were attended at the selected location for the date range.
Not Attended
The number of bookings that were not attended at the selected location for the date range.
Transactions
A table with the following information regarding the transactions for bookings only:
Store: the store for which the booking was made.
Ticket #: the ticket number.
Ticket Type: in this case the ticket type would be Booking.
Service: the required service to resolve the ticket.
Start Time: the time at which the customer joined the queue (start of journey).
End Time: the time at which the ticket was closed (end of journey).
Wait Time: the time from when the customer joined the queue to when he/she was called.
Serve Time: the time from when the consultant started serving the customer to when the ticket was closed.
Journey Time: the time from when the customer joined the queue to when the ticket was closed.
Status: the status of the ticket, which will be closed at the end of the transaction.
Consultant: the username of the consultant that served the ticket.
Ticket Transactions
Tickets
A table with the following information regarding all transactions:
Store: the store at which the ticket was generated.
Ticket #: the ticket number.
Ticket Type: the ticket type will either be Ticket or Booking.
Service: the required service to resolve the ticket.
Start Time: the time at which the customer joined the queue (start of journey).
End Time: the time at which the ticket was closed (end of journey).
Wait Time: the time from when the customer joined the queue to when he/she was called.
Serve Time: the time from when the consultant started serving the customer to when the ticket was closed.
Journey Time: the time from when the customer joined the queue to when the ticket was closed.
Status: the status of the ticket, which will be closed at the end of the transaction.
Consultant: the username of the consultant that served the ticket.
Staff Activity
Top 5 Staff (Lowest Average Serving Time)
A table, listing the names of the top 5 staff members, the number of tickets they served, their average serve times & total serve times within the selected date range.
Bottom 5 Staff (Highest Average Serving Time)
A table, listing the names of the bottom 5 staff members, the number of tickets they served, their average serve times & total serve times within the selected date range.
Staff Transactions
A table of staff transactions with the names of the consultants, the total tickets served, average serving times & current idle times. By clicking on the view buttons, a supervisor can take a closer look at the consultants’ profiles.
The staff profiles contain the following information:
- First Name
- Last Name
- Location
- Date Joined
- Total Served Tickets
- Average Serving Time
- Total Serving Time
- The number of tickets served per service
- Detail of the tickets served
CSR
Clicking on CSR in the menu bar on the left will take the supervisor to the ticket dashboard where he/she will have a view of all tickets.
Calendar
Clicking on the Calendar will take the supervisor to the view below.
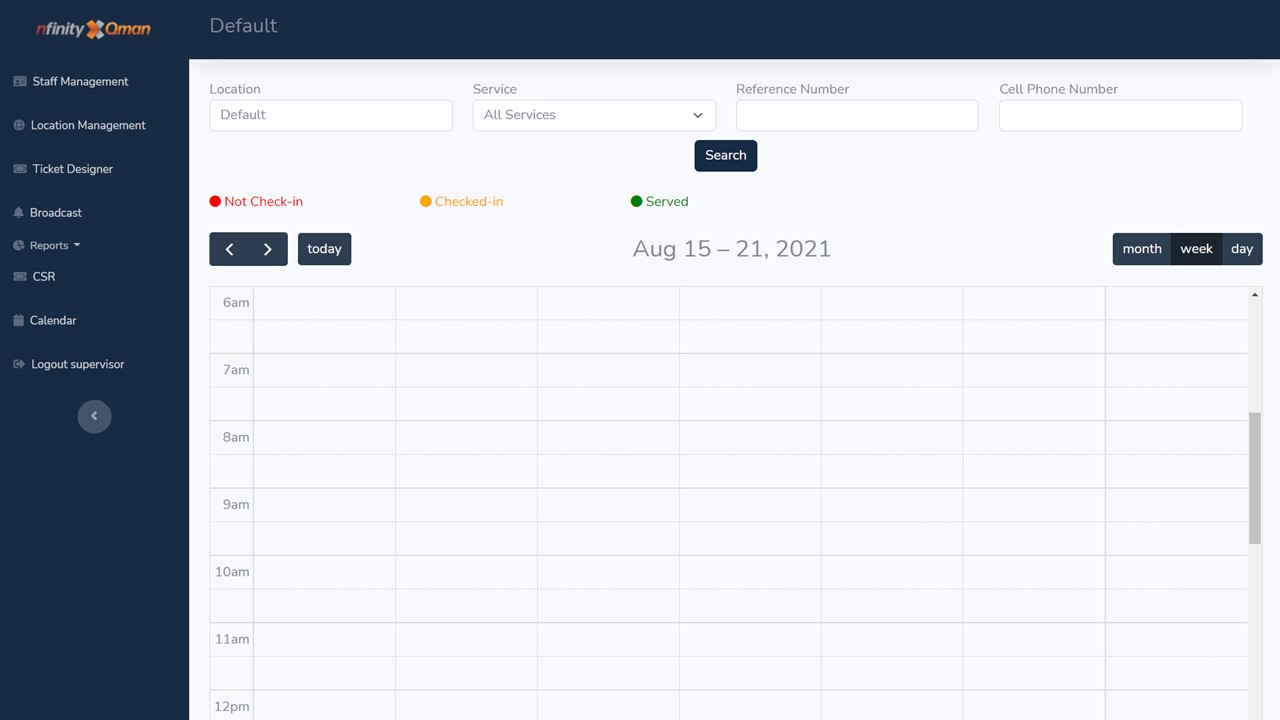
Bookings can be searched by:
Location
The store or branch.
Service
The type of service required by the customer.
Reference Number
The booking reference number generated by the system when the booking was made.
Cell Phone Number
The customer’s cell phone number.
Colour coded booking status
Bookings are colour coded according to the check-in statuses of the customers:
Not Checked-in – the customer has not arrived and checked in yet
Checked-in – the customer has arrived and checked in
Served – the customer has been served
Logout
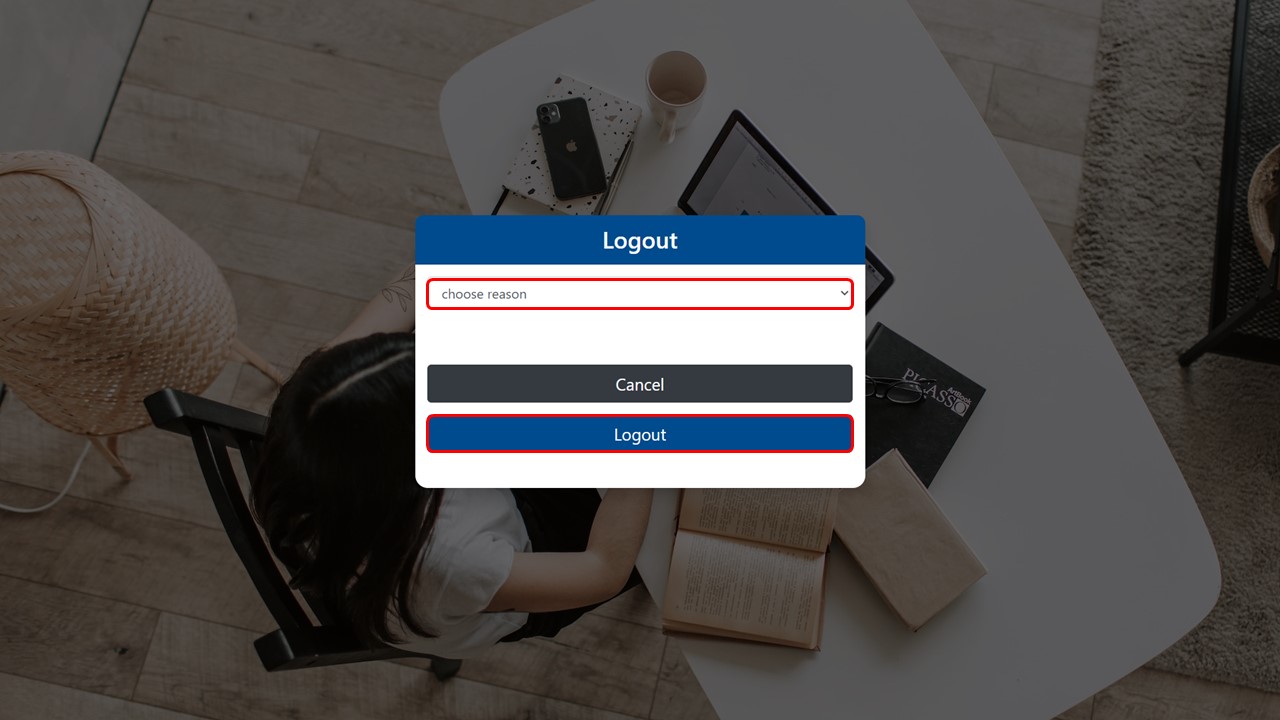
1. Select the reason for logging out and click on the Logout button.
Reasons for logging out: Finished, Lunch, Tea break, Bathroom break, Smoke break, Sick, Closing or Duplicate login.
