Step-by-step guide on how to populate the overview
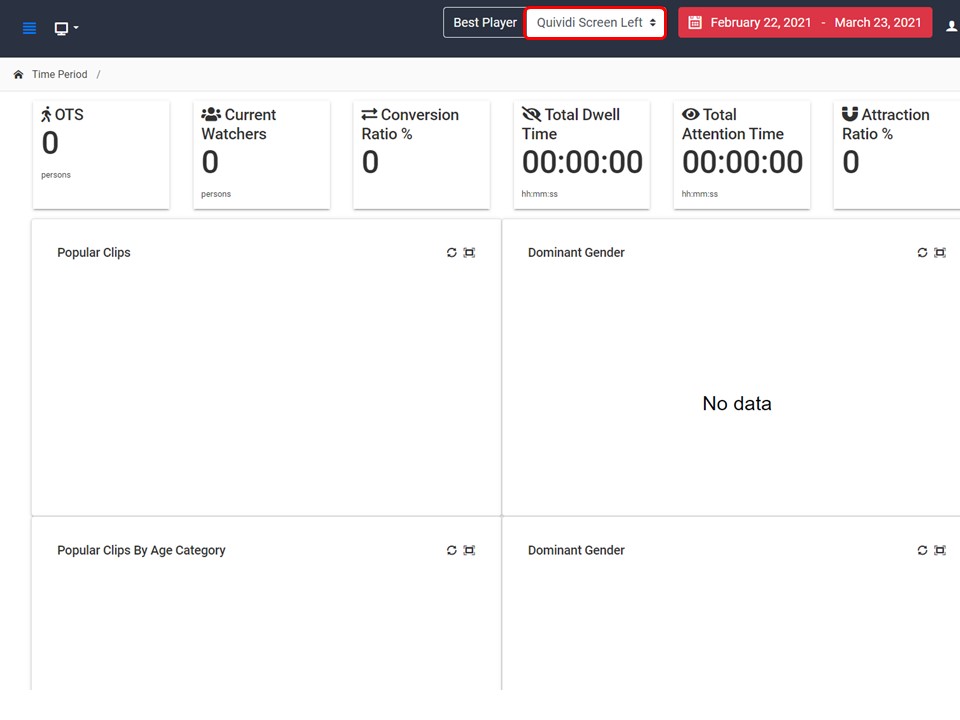
1. Select the relevant player from the drop-down.
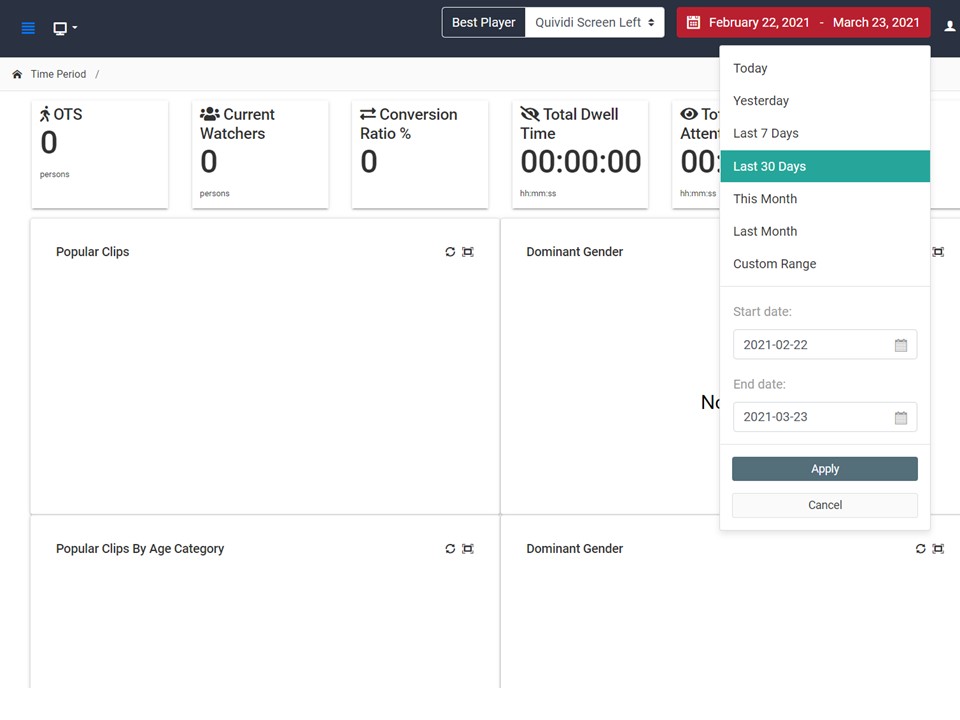
2. Select the date range that you want to include. When selecting from the top options the menu will disappear and the graphs will populate. If you select the date range manually, you will have to click on Apply.
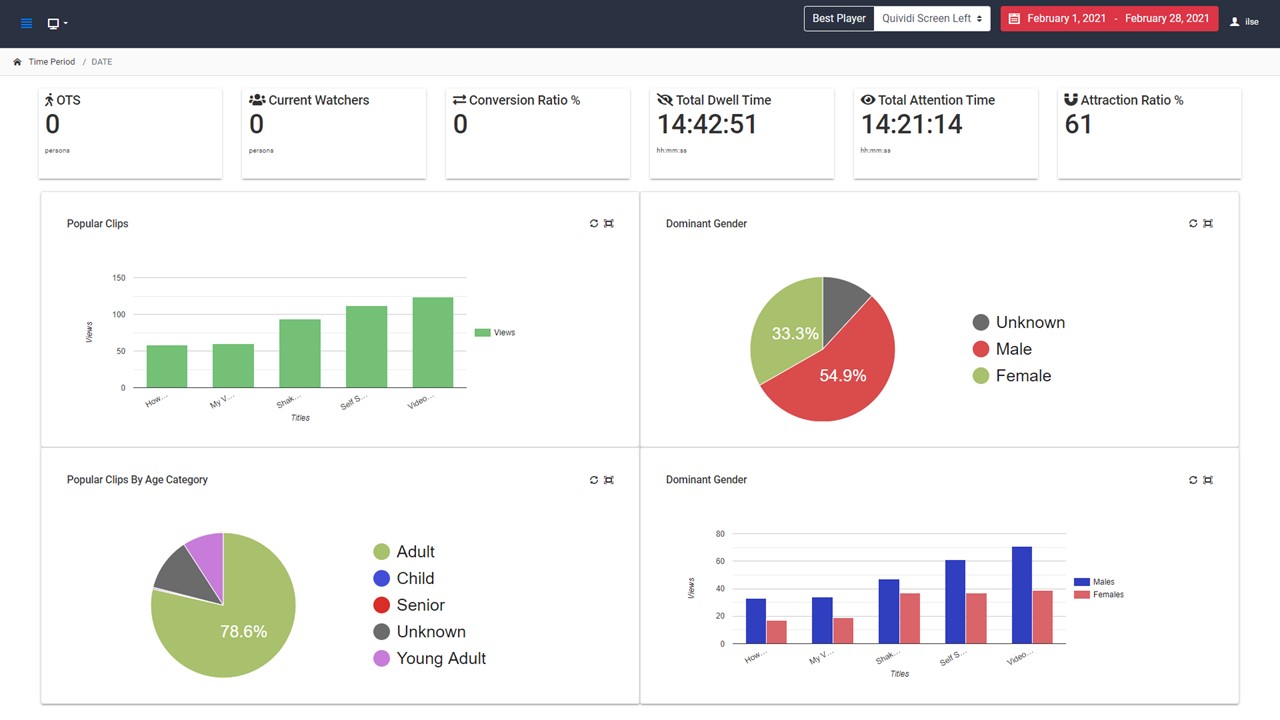
Step-by-step guide on how to pull a Quividi report
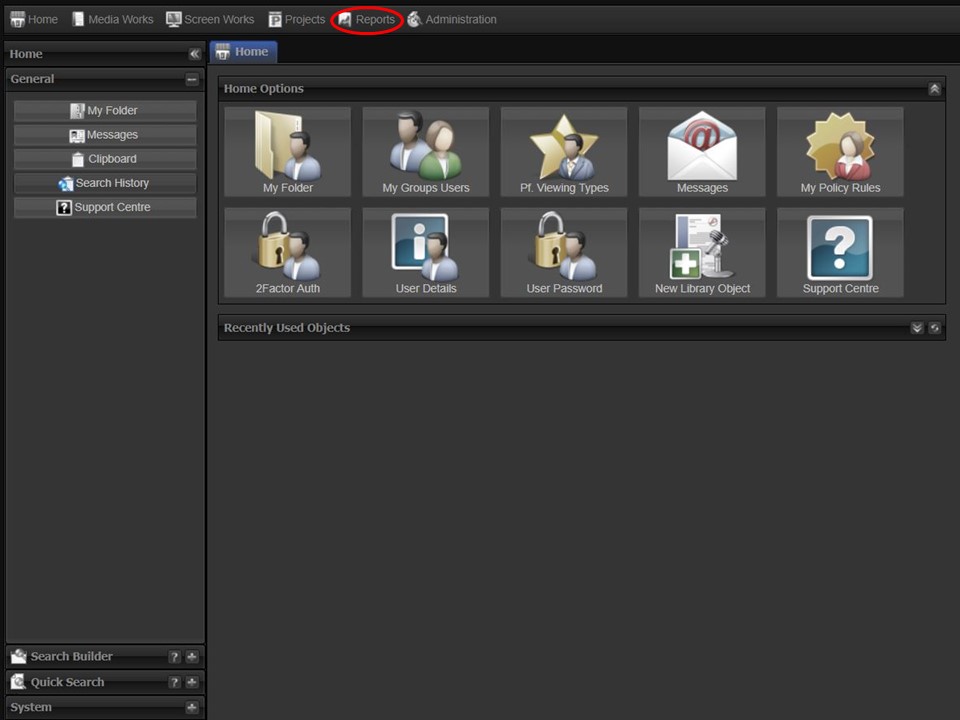
1. Click on the Reports tab at the top of the screen.
2. Click on the Quividi icon. The interface will open.
Quividi dashboard overview
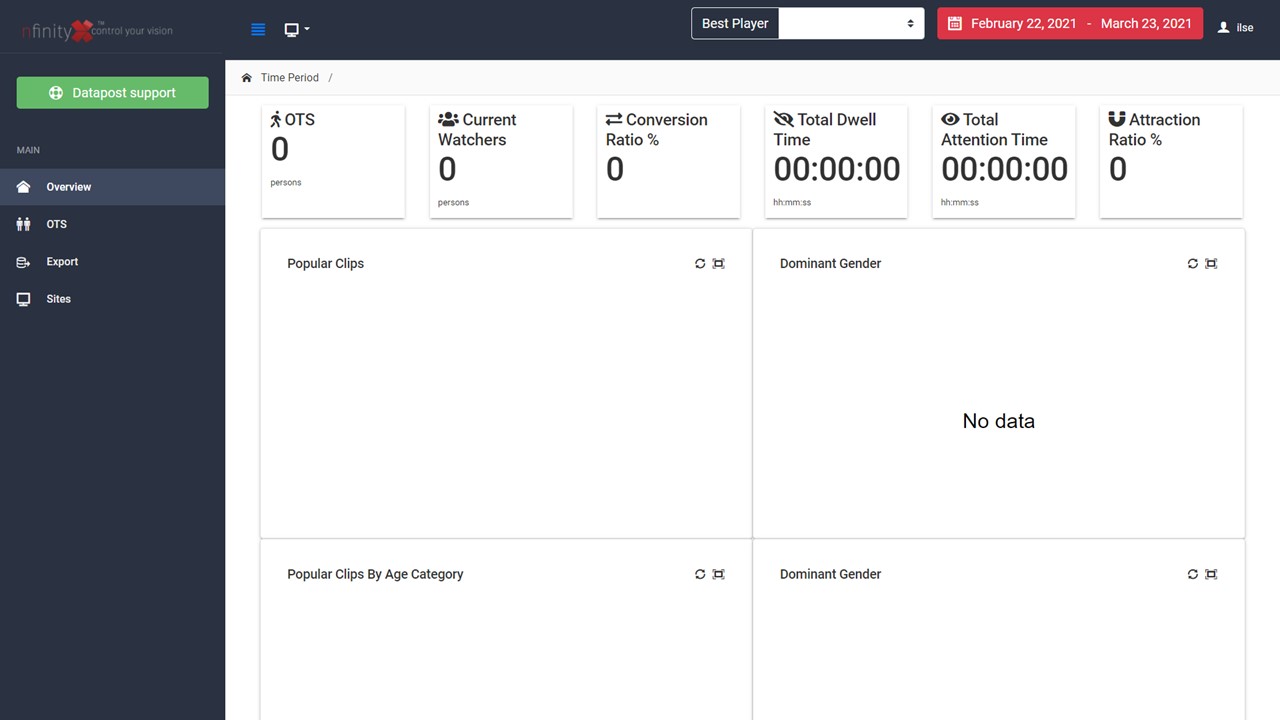
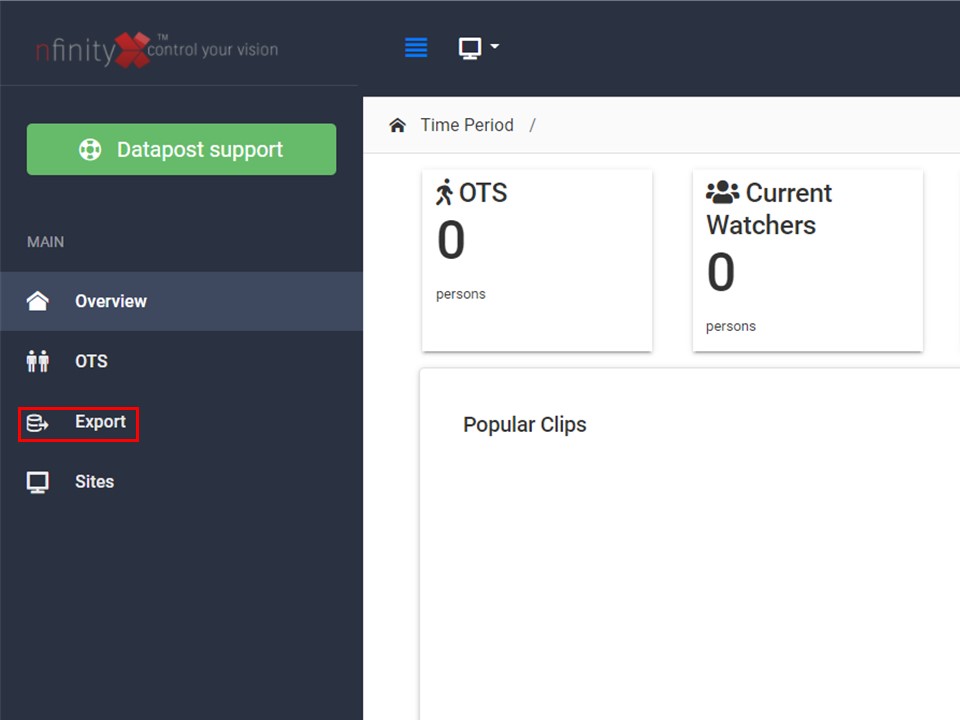
3. Click on Export. The Quividi reporting interface will open.
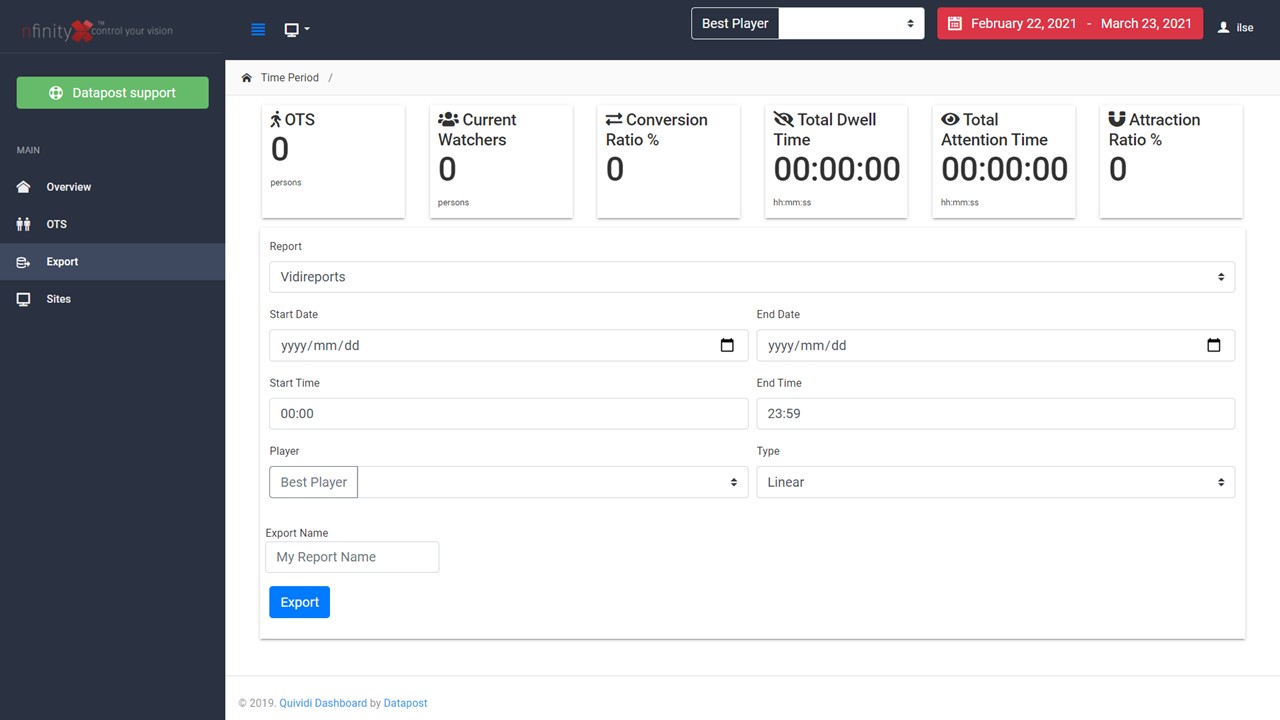
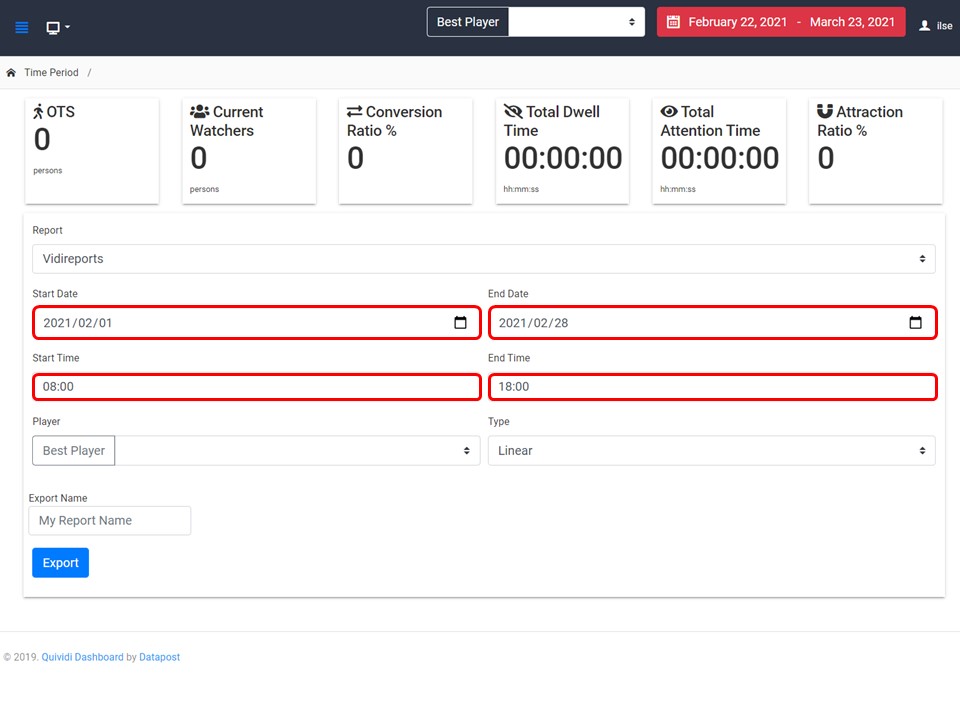
4. Select the Start Date, End Date, Start Time & End Time.
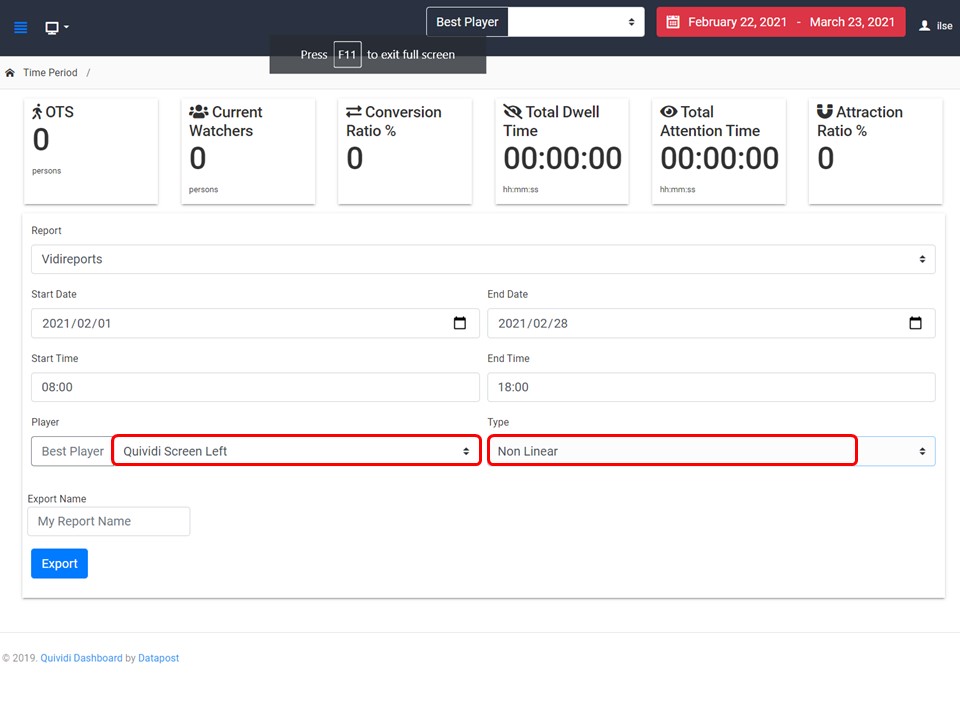
5. Select the relevant player & report type from the respective drop-downs.
Handy Tip
You will select the non-linear report type, if you want to pull a report for a specific time of day within a date range. The linear type will give you data from the start date & time until the end date & time.
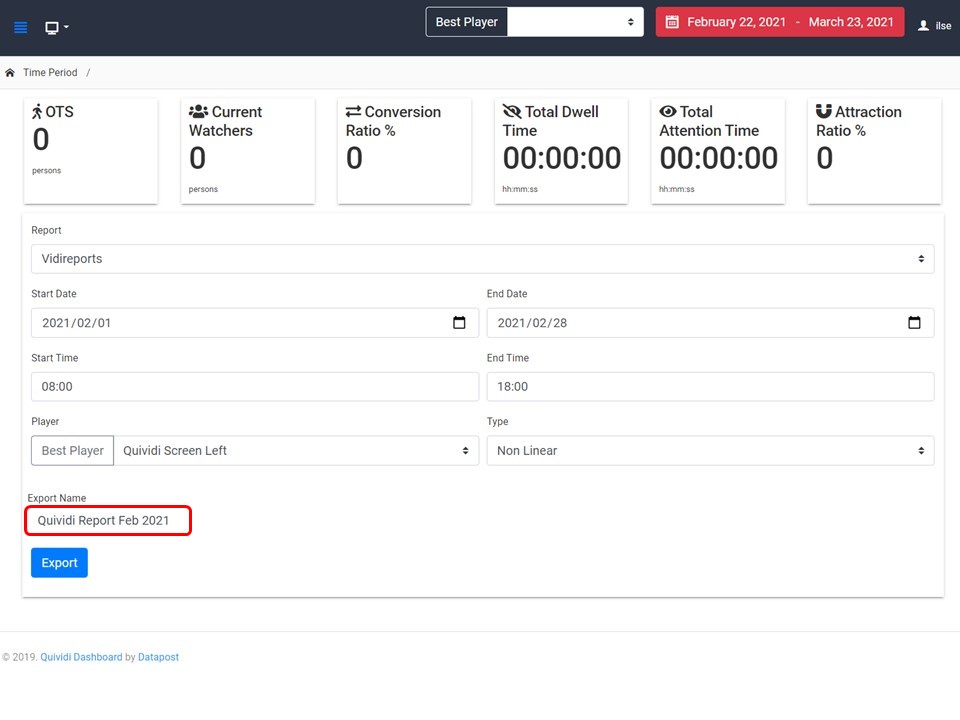
6. Name your report.
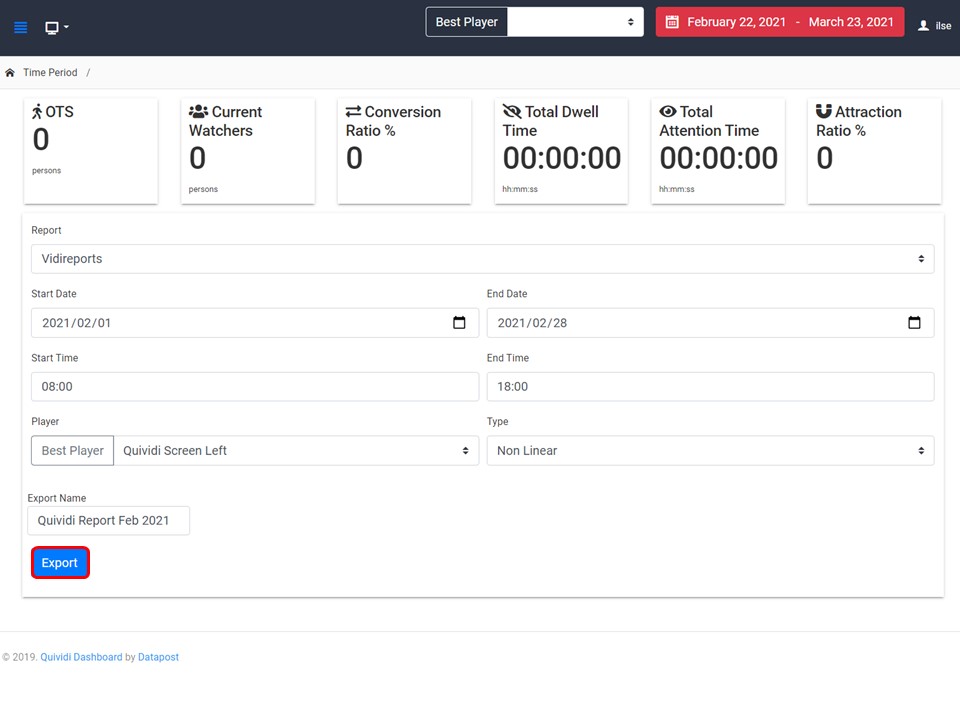
7. Click on the Export button to download the report (csv) to your machine.
